Drag to explore. Scroll or pinch to zoom. Open Help for keyboard controls.

Yan
OPEN
TO WORK
Let’s talk
Yan Fontão Boring view
All work

Case 006Mobile app design

TerasApp

A mobile app for TERAS IoT temperature sensors on farms: pairing devices, reading the latest temperature, following sensor records and exporting reports. All readings are sample data.

Contribution
Product flows and interface design
Project status
Interface design · Figma archive
TerasApp logo on a black disc.
The logo.

01

My contribution

TerasApp is the Portuguese-language companion to TERAS temperature sensors. Each sensor gets a name, such as the sample “Caldeira da fazenda 1”, and the app is built around three checks: the latest reading, the state of the sensor and how the temperature behaved over the last seven days.

The Figma file keeps the whole chain, from low-fi wireframes (onboarding, access, home, pairing, device) to a prototype of 31 mobile frames and the components behind it. Here I focus on the screens that carry those three checks.
Recorded from the Figma prototype. Login, a search for nearby sensors, and two new devices added to the list.
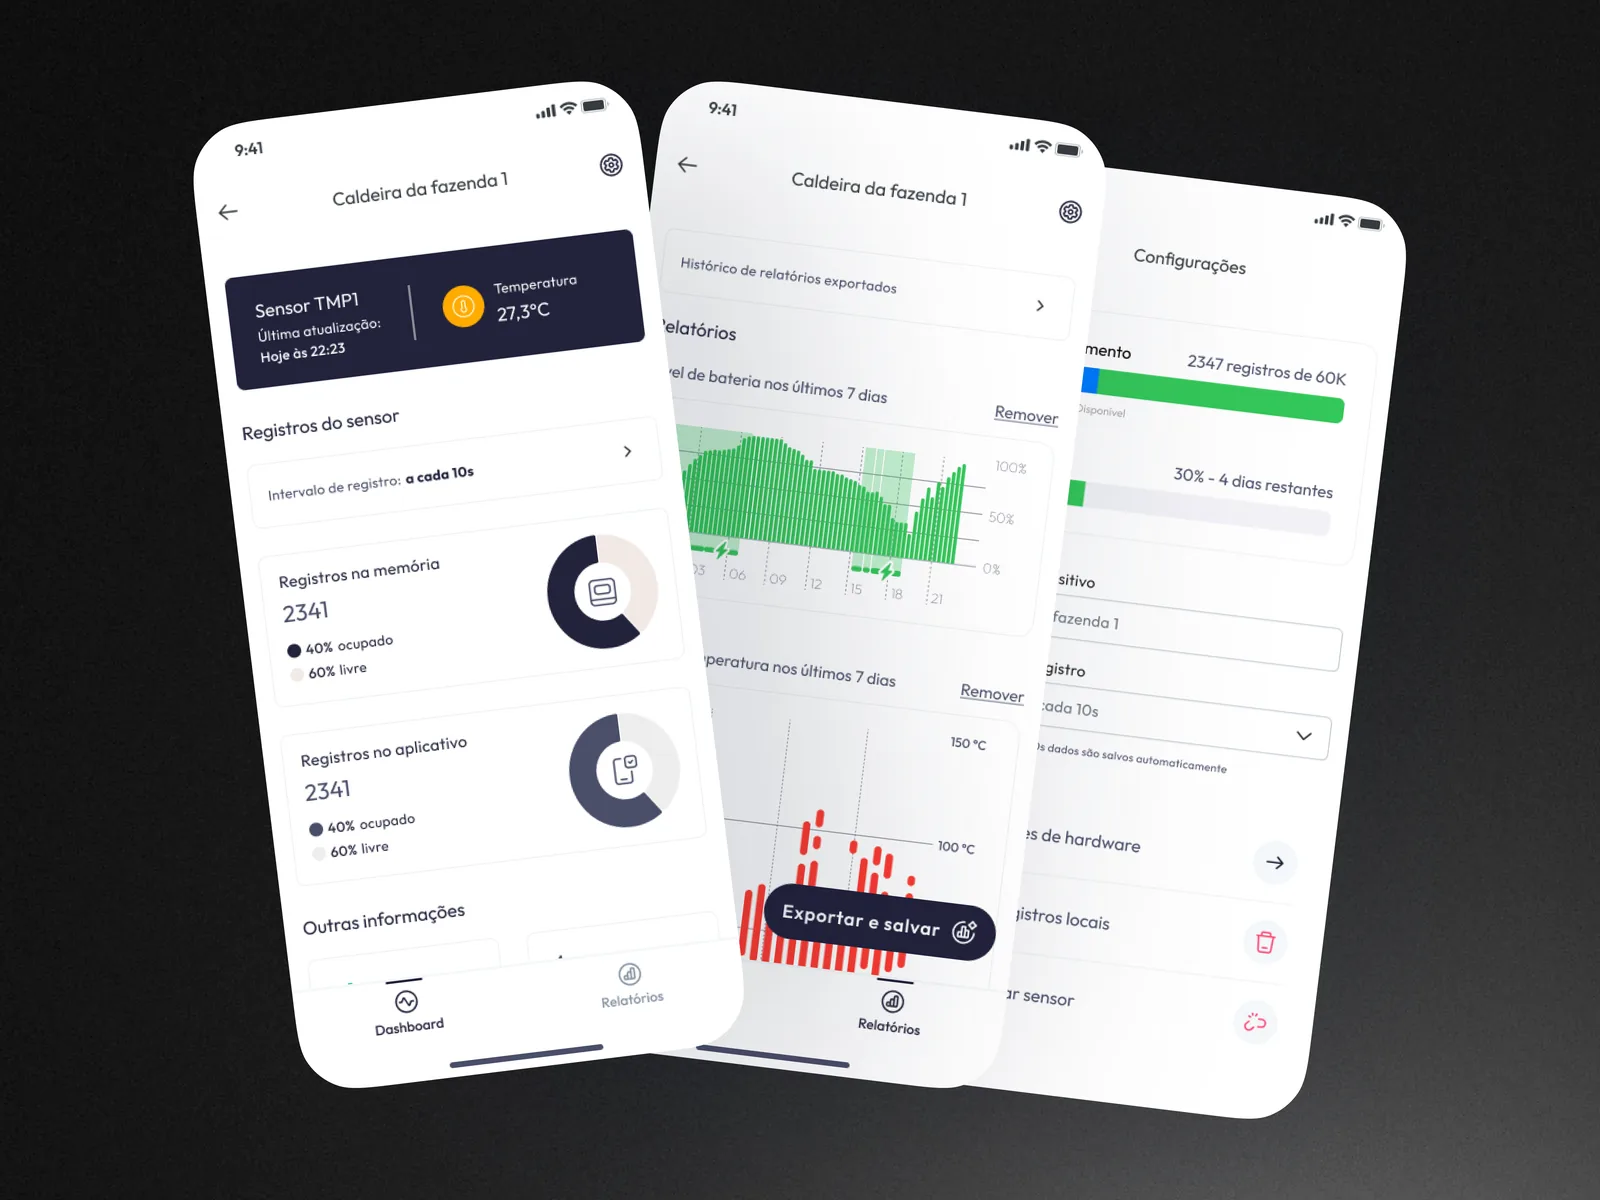
Three tilted screens on a dark background: the device dashboard, reports with battery and temperature charts, and settings.
One sensor seen through its dashboard, reports and settings.

02

The reading comes first

The device page opens with a dark card holding the sensor’s name, the time of the last update and the temperature, the one block on the page with strong contrast. Below it come the logging interval and the records stored in memory and in the app, then signal and battery. Read from top to bottom, the screen goes from the number to the state of the sensor behind it.
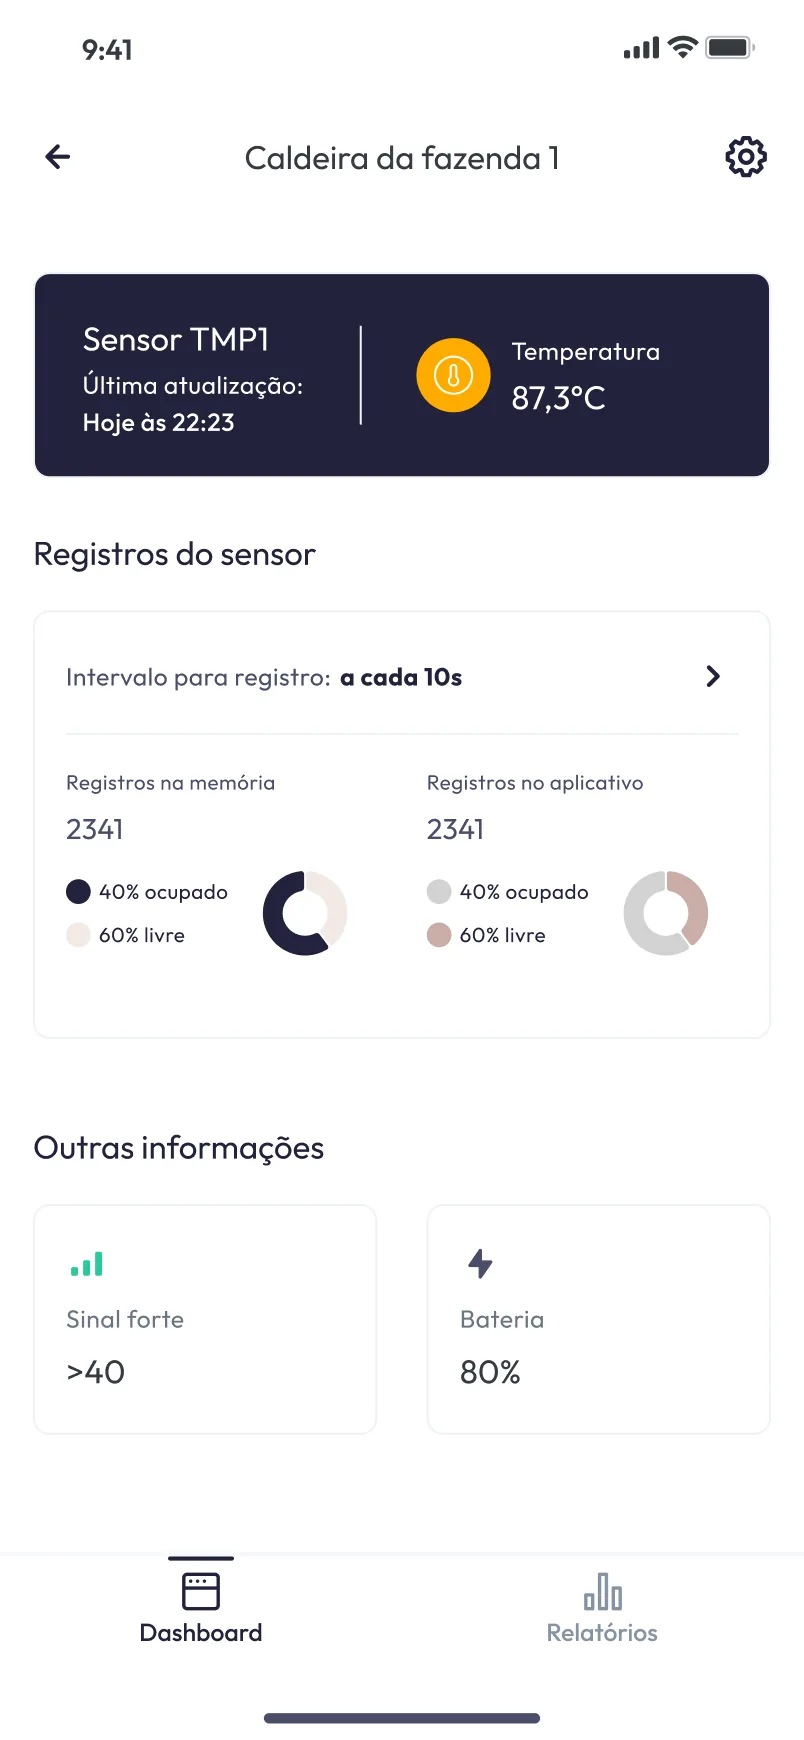
Device page for Caldeira da fazenda 1, with a dark card showing Sensor TMP1 and its temperature, then sensor records, signal and battery.
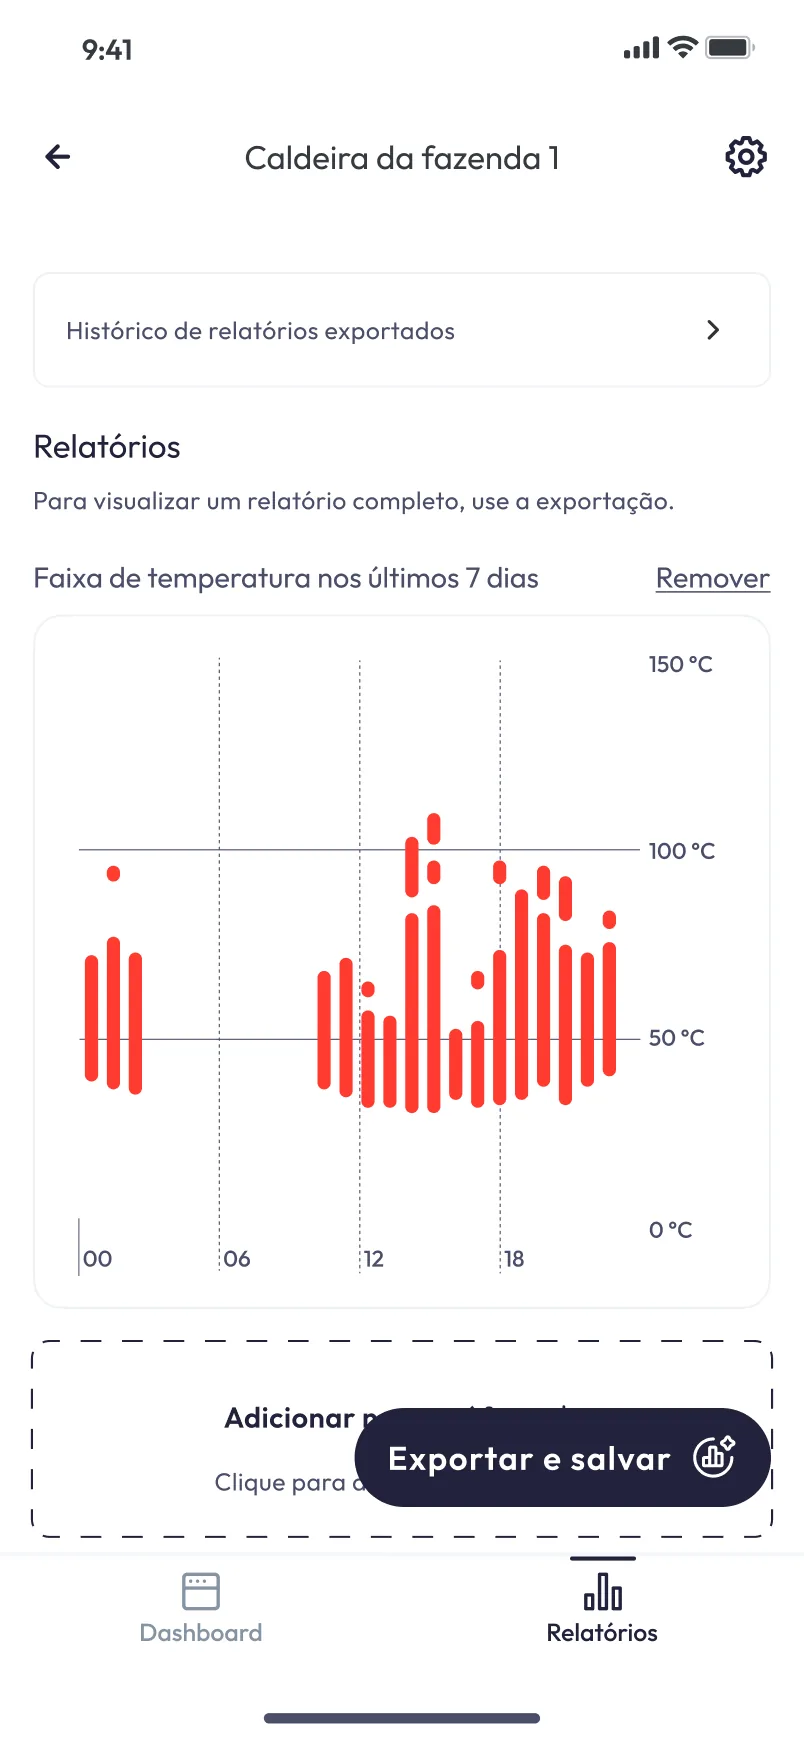
Reports screen with a red bar chart of the temperature range over the last seven days and an Exportar e salvar button.
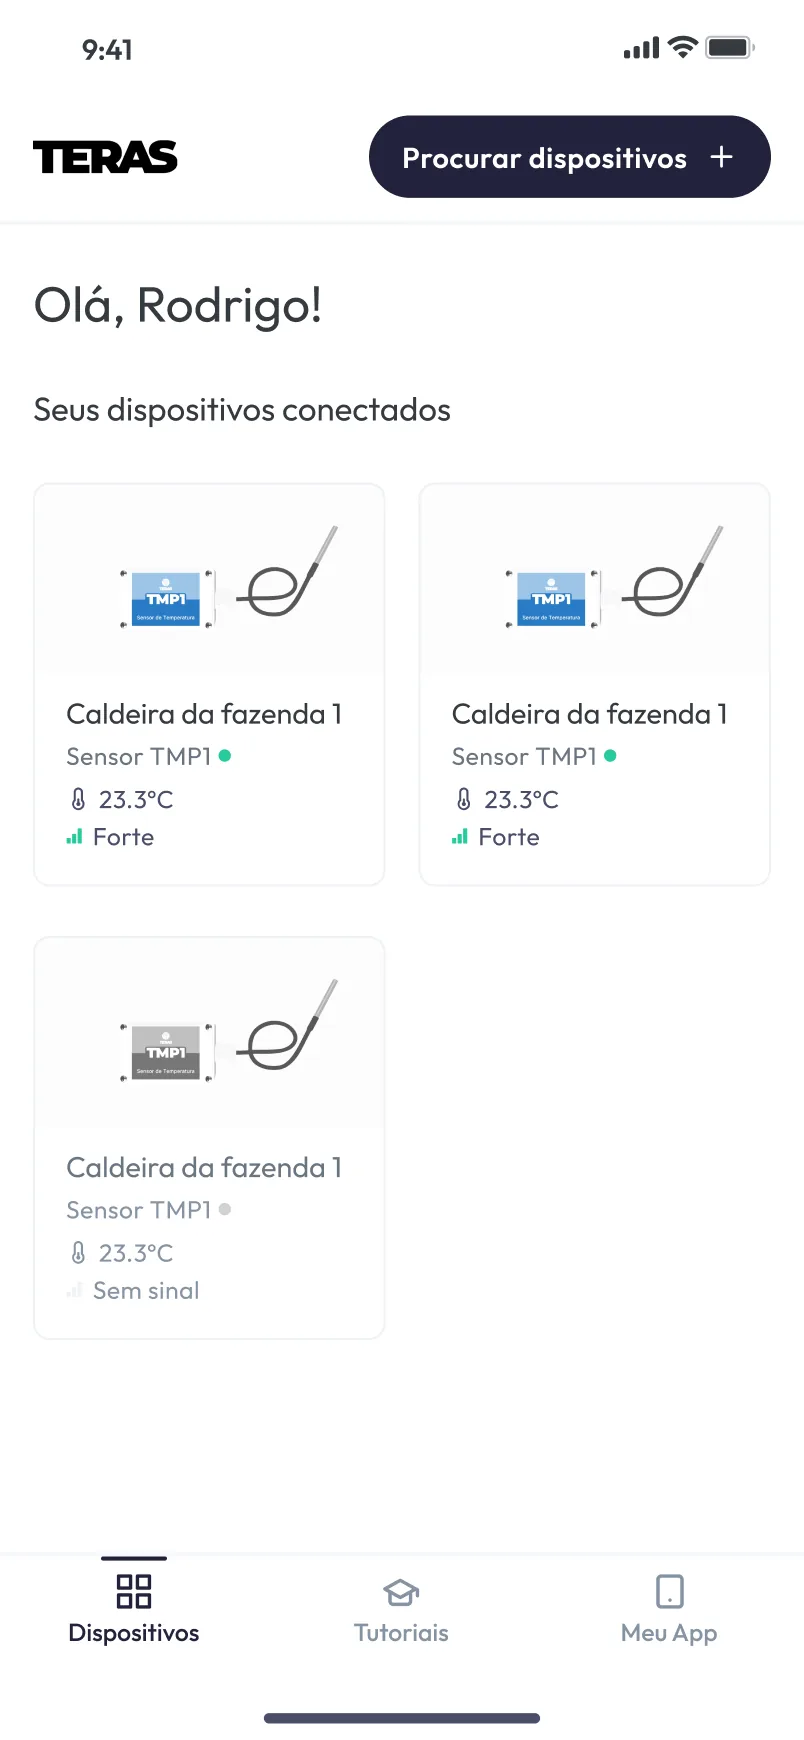
Home screen with the TERAS logo, a Procurar dispositivos button and three device cards, one greyed out with no signal.
The device page leads with the latest reading. Reports chart the temperature range of the last seven days. The home lists each connected sensor with its status and signal.

03

Seven days of temperature in one chart

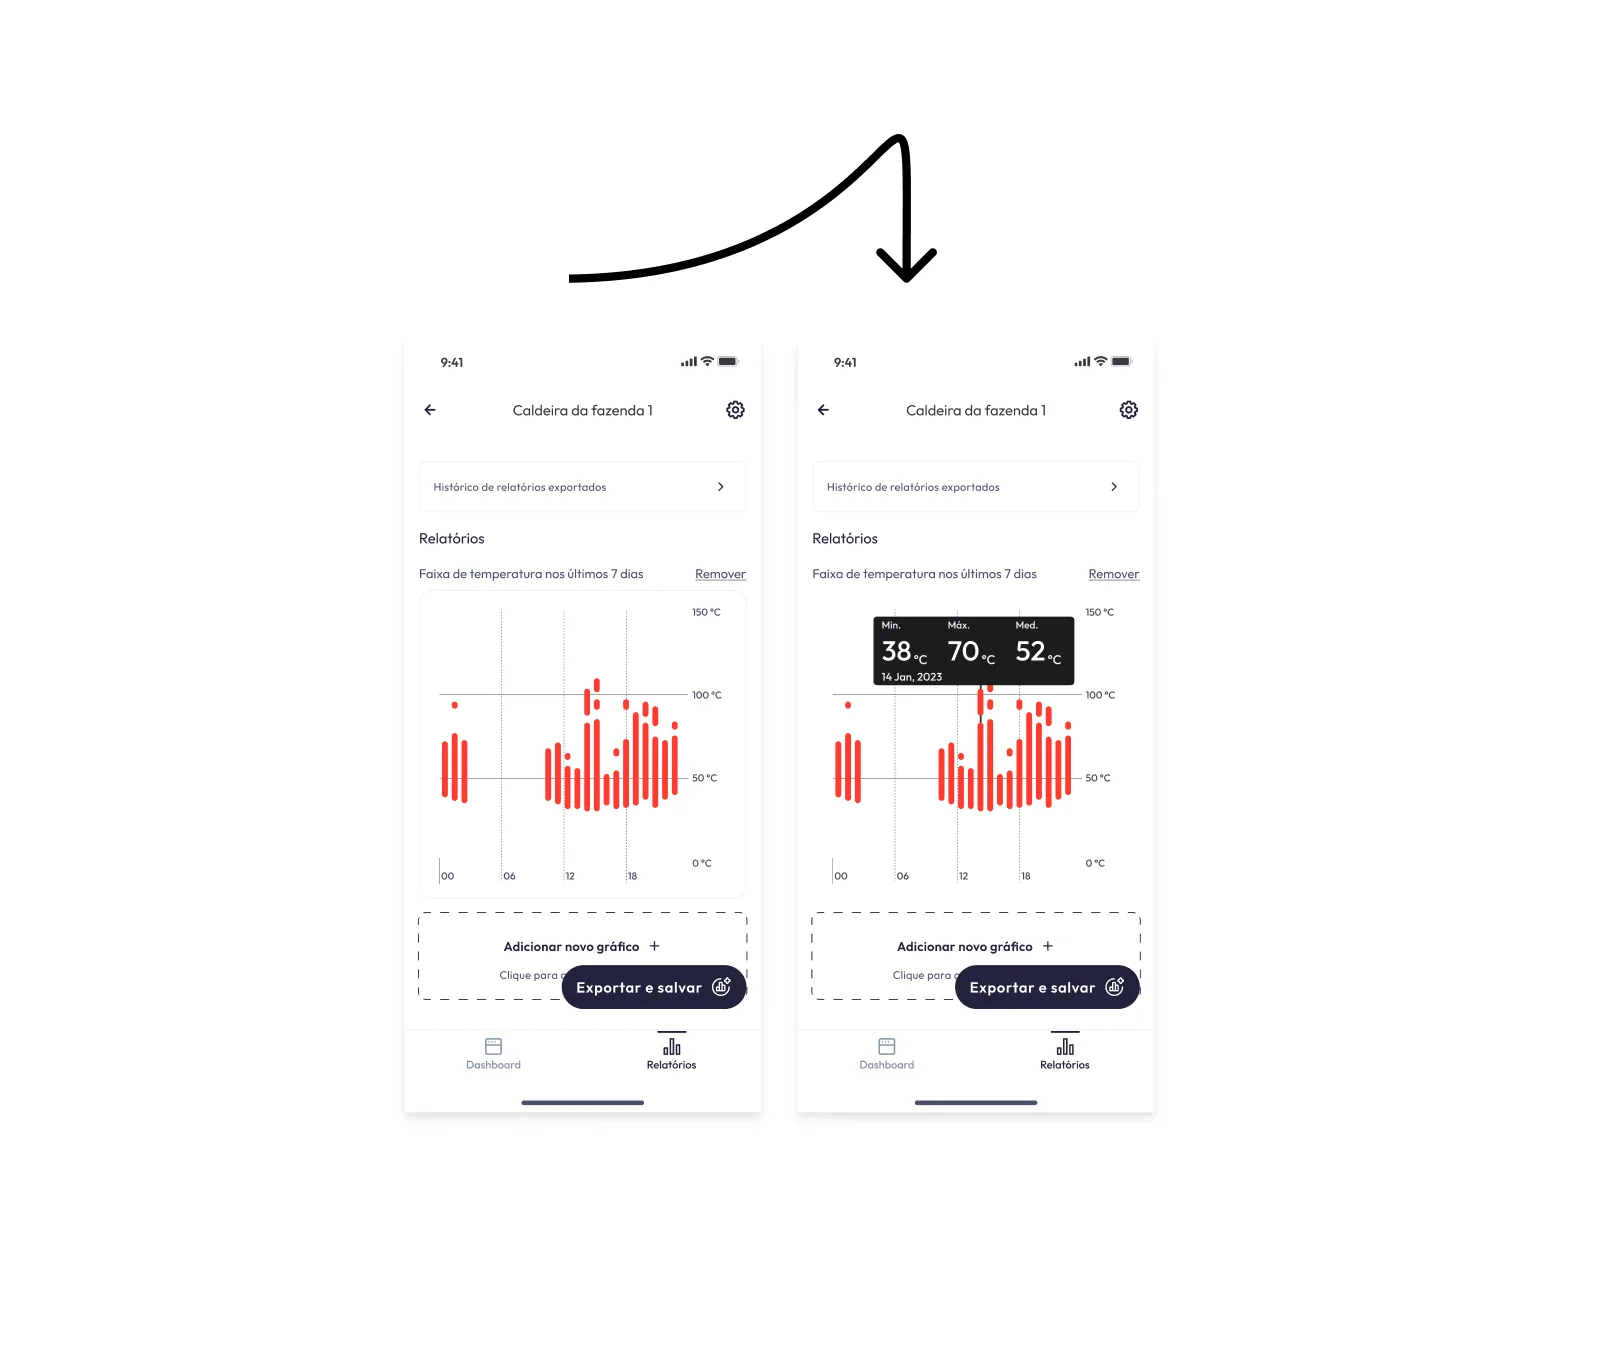
Relatórios shows the temperature range of the last seven days as red bars against fixed lines at 50 and 100 °C. Selecting a bar opens a dark tooltip with the minimum, maximum and average for that point, so the chart stays clean until someone asks for detail. Charts can be added and removed, and a report can be exported and saved, with past exports kept in a history.

Two versions of the reports screen joined by a hand-drawn arrow: the chart at rest, and the same chart with a dark tooltip of minimum, maximum and average.
Selecting a bar opens the minimum, maximum and average.

04

Finding and looking after a sensor

The home lists connected devices as cards with status, temperature and signal, and a sensor without signal fades to grey. Procurar dispositivos leads to a pairing list that marks each sensor’s signal as Forte, Médio or Fraco. Settings gathers storage, battery, the device name and the logging interval, and keeps the two destructive actions, clearing local records and disconnecting the sensor, at the end of the screen with red icons.

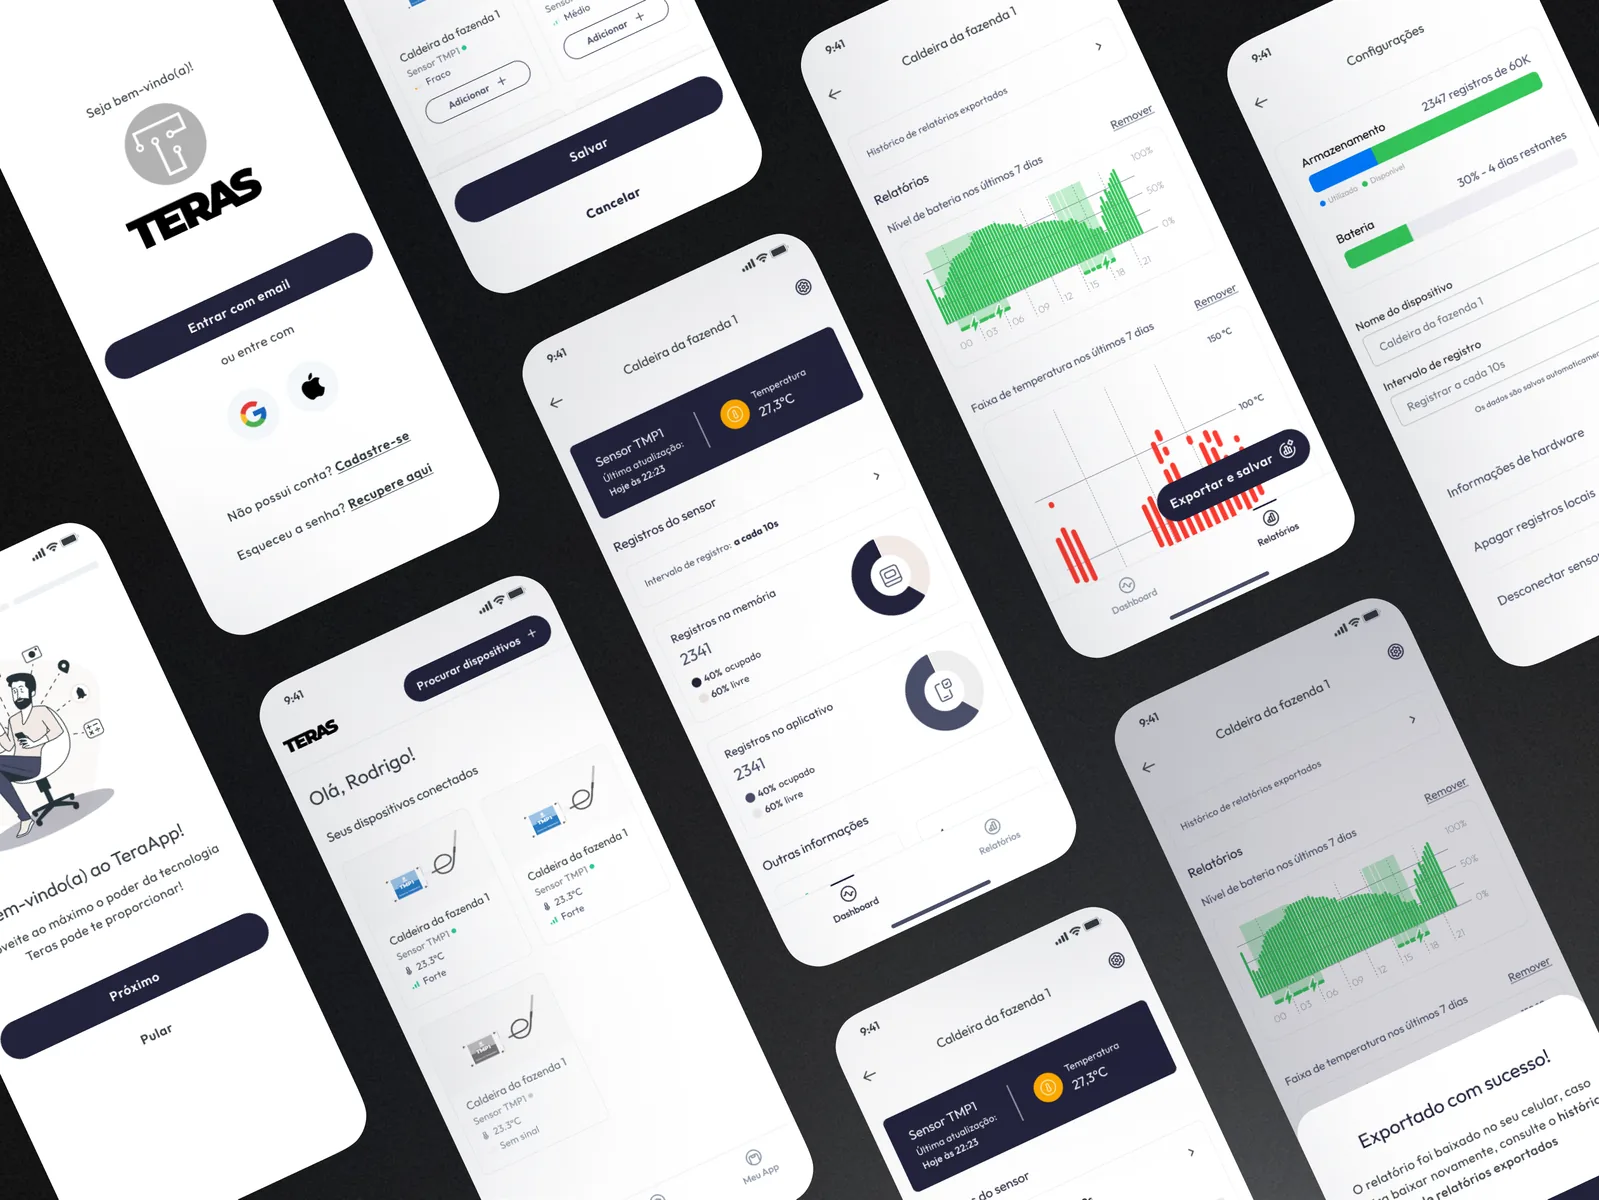
A dense diagonal grid of app screens: onboarding, sign-in, the device list, pairing, the device dashboard, reports, settings and an export confirmation.
The app from onboarding to an exported report.
000

Instructions

Yan Fontão
Tap
Open a screen
Click
Open a screen
Drag
Look around the board
Wheel
Mouse zooms, trackpad moves, pinch zooms
− +
Pull back to see the whole board, or come closer
Arrows
In a case: ↑↓ change case, ←→ change media. On the board: move
Space
Open, or go back
Enter
Open
Esc Backspace
Back
Home
Back to the center, then the introduction
PgUp PgDn
Previous or next channel
Tab
Walk projects and links
R
Random project
0–9
Type a channel, 1–61
?
This page
Shortcuts

Music on the board

Files compressed and levelled for the web.

OPEN
TO WORK
Let’s talk

New message to Yan

Tell me who you are and I’ll get back to you.

000

About Yan

Hello, I’m Yan

Product Designer/ Design Engineer

Most products lose something between design and code. Mine don’t: I research the problem, design the product and ship the interface myself, so what you approve is exactly what your users get.

  • 2018started in software
  • UI + codedesign and implementation

Worked with Motorola · Ambev Tech · Rei do Pitaco · OneTool · CESAR

Brazil · Remote, hybrid or on-site

Portrait of Yan Fontão seated, in a green sweater and glasses, holding a microphone.
OPEN
TO WORK
Let’s talk
OPEN
TO WORK
Let’s talk
000

locked channel

Under NDA

Enter the code

Ask Yan for the code ↗
OPEN
TO WORK
Let’s talk
YAN FONTÃO Case studies

Channel 06 Mobile app design

TerasApp

A mobile app for TERAS IoT temperature sensors on farms: pairing devices, reading the latest temperature, following sensor records and exporting reports. All readings are sample data.

Contribution
Product flows and interface design
Project status
Interface design · Figma archive

See it on Dribbble

TerasApp logo on a black disc.
The logo.

A farm sensor, readable from a phone

Screens from the original design in Figma and Dribbble, with sample data.

My contribution

TerasApp is the Portuguese-language companion to TERAS temperature sensors. Each sensor gets a name, such as the sample “Caldeira da fazenda 1”, and the app is built around three checks: the latest reading, the state of the sensor and how the temperature behaved over the last seven days.

The Figma file keeps the whole chain, from low-fi wireframes (onboarding, access, home, pairing, device) to a prototype of 31 mobile frames and the components behind it. Here I focus on the screens that carry those three checks.

Recorded from the Figma prototype. Login, a search for nearby sensors, and two new devices added to the list.
Three tilted screens on a dark background: the device dashboard, reports with battery and temperature charts, and settings.
One sensor seen through its dashboard, reports and settings.

The reading comes first

The device page opens with a dark card holding the sensor’s name, the time of the last update and the temperature, the one block on the page with strong contrast. Below it come the logging interval and the records stored in memory and in the app, then signal and battery. Read from top to bottom, the screen goes from the number to the state of the sensor behind it.
Device page for Caldeira da fazenda 1, with a dark card showing Sensor TMP1 and its temperature, then sensor records, signal and battery.
The device page leads with the latest reading.
Reports screen with a red bar chart of the temperature range over the last seven days and an Exportar e salvar button.
Reports chart the temperature range of the last seven days.

Seven days of temperature in one chart

Relatórios shows the temperature range of the last seven days as red bars against fixed lines at 50 and 100 °C. Selecting a bar opens a dark tooltip with the minimum, maximum and average for that point, so the chart stays clean until someone asks for detail. Charts can be added and removed, and a report can be exported and saved, with past exports kept in a history.
Home screen with the TERAS logo, a Procurar dispositivos button and three device cards, one greyed out with no signal.
The home lists each connected sensor with its status and signal.
Two versions of the reports screen joined by a hand-drawn arrow: the chart at rest, and the same chart with a dark tooltip of minimum, maximum and average.
Selecting a bar opens the minimum, maximum and average.

Finding and looking after a sensor

The home lists connected devices as cards with status, temperature and signal, and a sensor without signal fades to grey. Procurar dispositivos leads to a pairing list that marks each sensor’s signal as Forte, Médio or Fraco. Settings gathers storage, battery, the device name and the logging interval, and keeps the two destructive actions, clearing local records and disconnecting the sensor, at the end of the screen with red icons.
A dense diagonal grid of app screens: onboarding, sign-in, the device list, pairing, the device dashboard, reports, settings and an export confirmation.
The app from onboarding to an exported report.