Drag to explore. Scroll or pinch to zoom. Open Help for keyboard controls.

Yan
OPEN
TO WORK
Let’s talk
Yan Fontão Boring view
All work

Case 028Mobile app design

Heartbeat

A concept for a health app shaped by one frustration of a fictional user: plenty of raw data and no word on what it means. It pairs a map of his experience with screens that turn readings into a plain status.

Contribution
Product flows and interface design
Project status
Mobile app concept · Figma archive
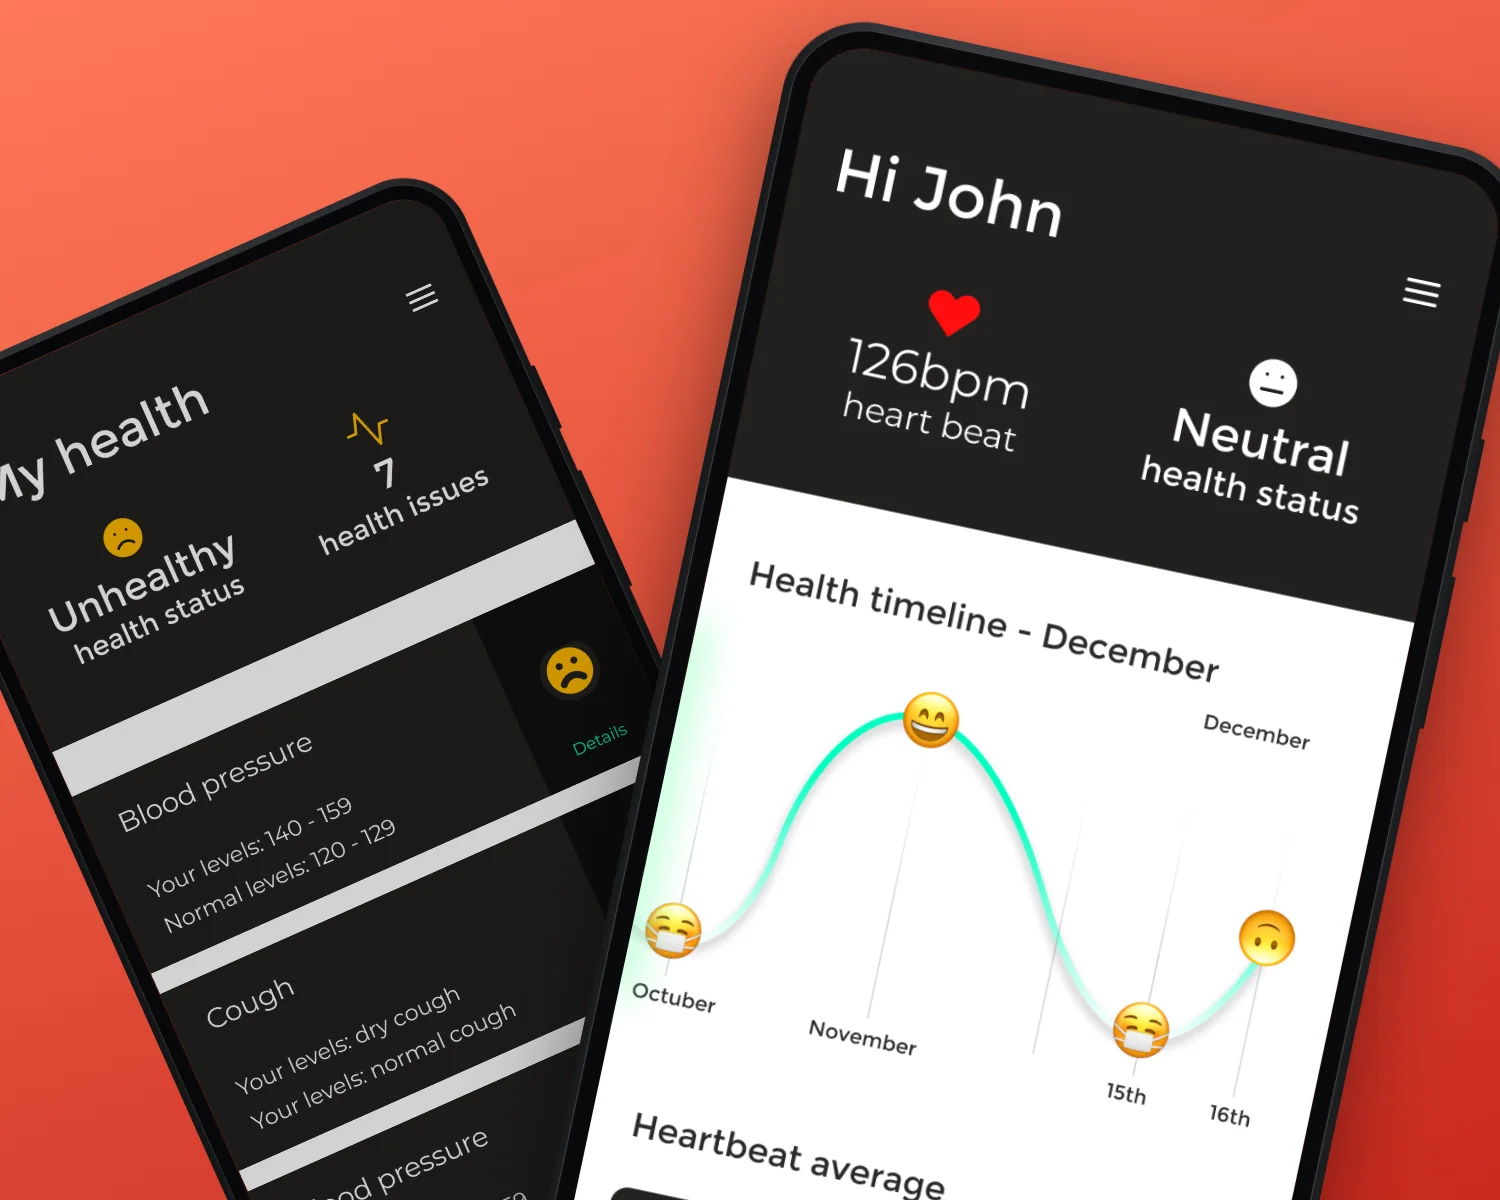
Mockup of heartbeat composed for this board from real screens of the project.
Mockup composed for this board from real project screens.

01

My contribution

Heartbeat is a mobile health app concept. Its description in the file asks for little data entry, a clear view of a person's health state and alerts for Covid symptoms.

I designed the screens around John, a fictional user, and every reading is sample data.

Recorded from the Figma prototype. A round watch face: the heart rate, then a short symptom check.

02

From raw data to a plain answer

The concept starts with a map of John across six stages, from searching for apps to sharing one. His low point comes when he tests existing apps and finds them aimed at healthy people tracking workouts, heartbeat and blood pressure, with no feedback on what the numbers mean.

That gap sets the hierarchy of the screens. Home leads with a heart rate beside a one-word health status, then a timeline that marks each point with a face instead of a value.
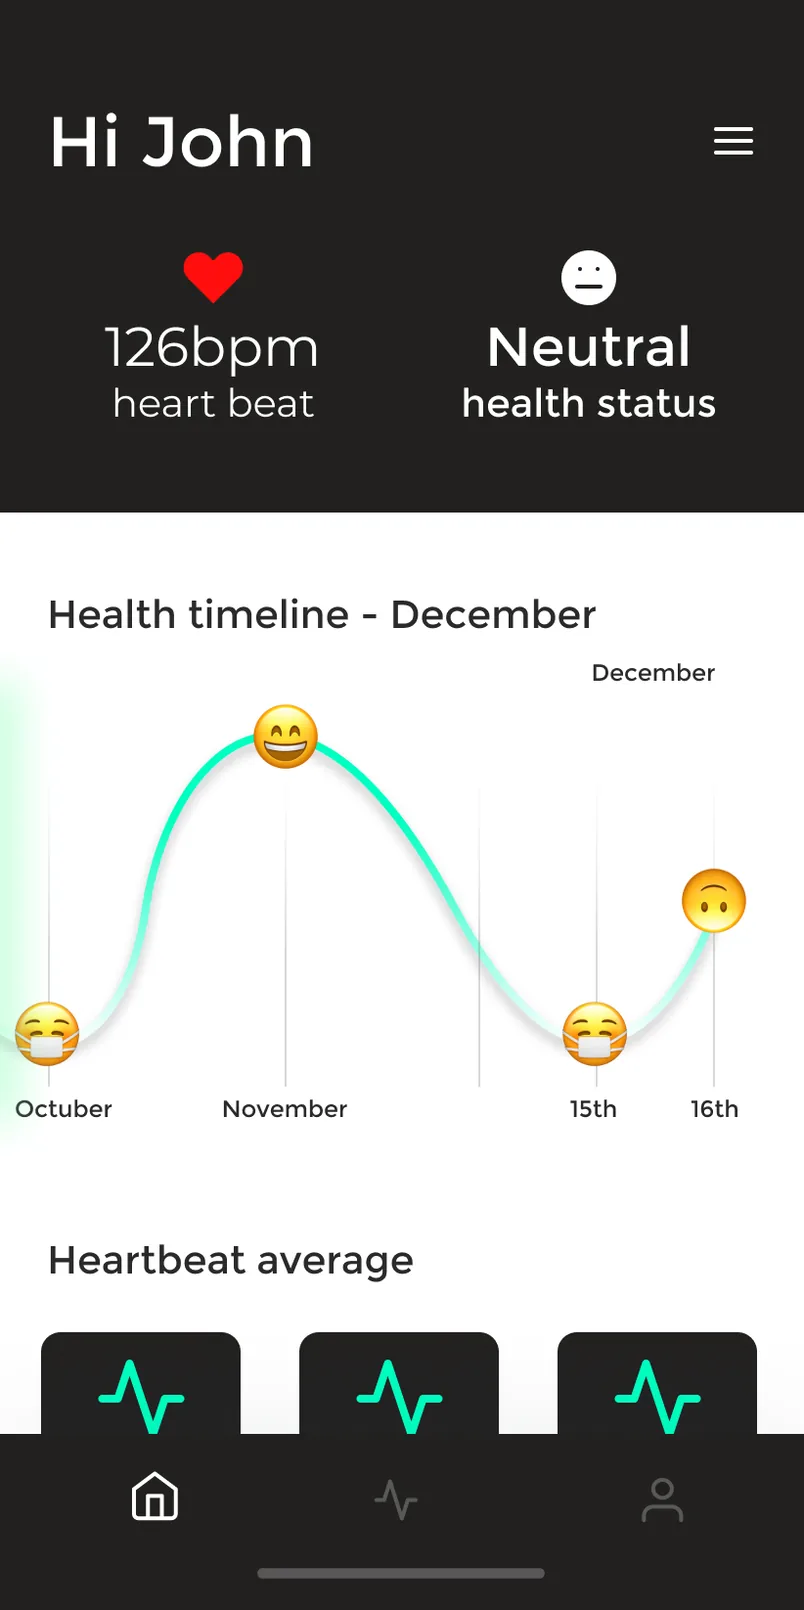
Home screen greeting John, with a heart rate of 126 bpm beside a Neutral health status, and a green timeline curve marked with emoji faces.
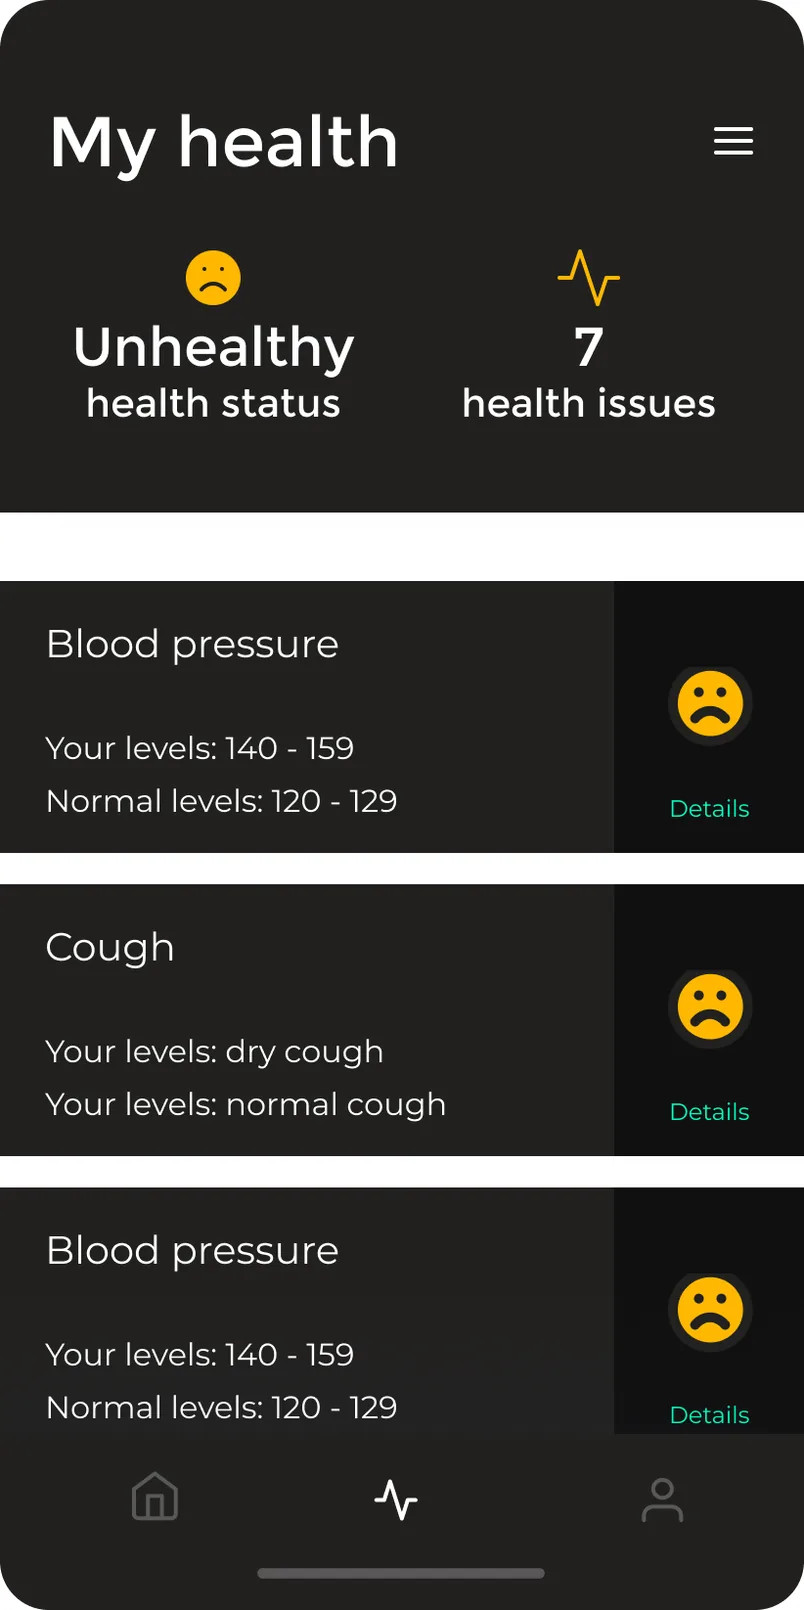
My health screen with a status summary and dark cards for blood pressure and cough, each comparing the person's level with the normal range and linking to Details.
Home: a reading, a one-word status and a timeline of faces. Sample data. My health: each issue compares the person's level with the normal range. Sample data.

03

When a reading needs attention

My health lists each issue with the person's level beside the normal range, so the comparison sits on the card and Details is one tap away.
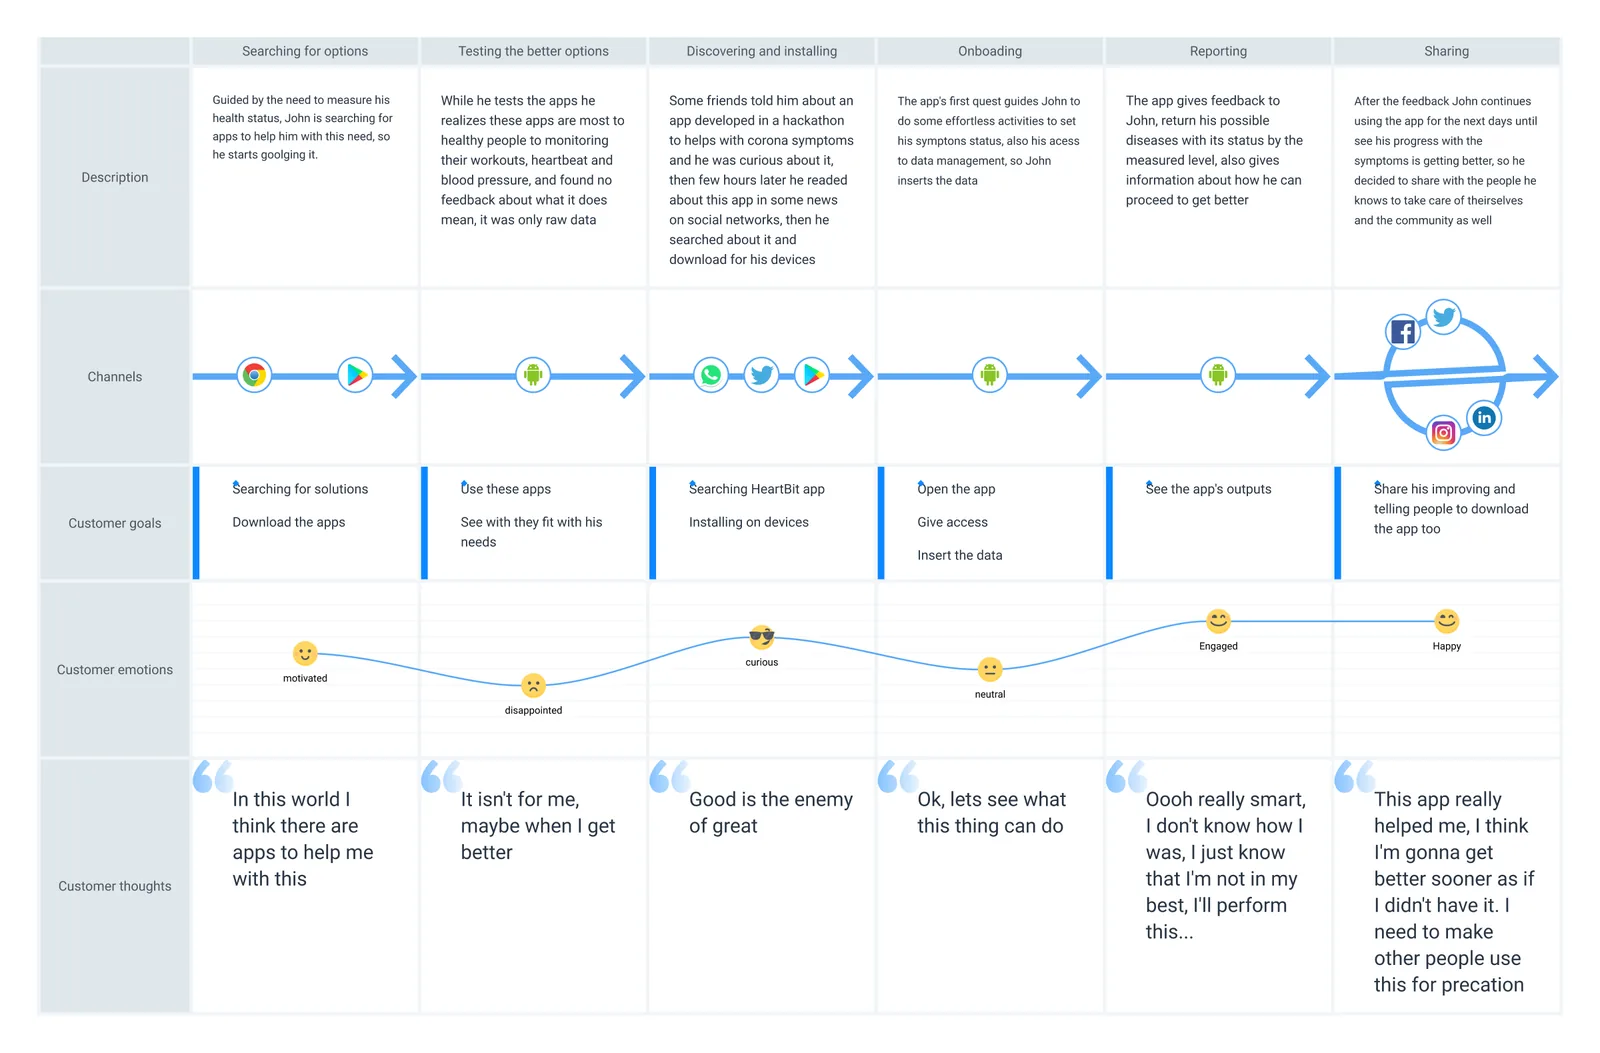
Table following a fictional user across six stages, with rows for description, channels, goals, emotions and thoughts, and a curve rising from disappointed to happy.
Experience map of John, a fictional user. The quotes are part of the persona.
000

Instructions

Yan Fontão
Tap
Open a screen
Click
Open a screen
Drag
Look around the board
Wheel
Mouse zooms, trackpad moves, pinch zooms
− +
Pull back to see the whole board, or come closer
Arrows
In a case: ↑↓ change case, ←→ change media. On the board: move
Space
Open, or go back
Enter
Open
Esc Backspace
Back
Home
Back to the center, then the introduction
PgUp PgDn
Previous or next channel
Tab
Walk projects and links
R
Random project
0–9
Type a channel, 1–61
?
This page
Shortcuts

Music on the board

Files compressed and levelled for the web.

OPEN
TO WORK
Let’s talk

New message to Yan

Tell me who you are and I’ll get back to you.

000

About Yan

Hello, I’m Yan

Product Designer/ Design Engineer

Most products lose something between design and code. Mine don’t: I research the problem, design the product and ship the interface myself, so what you approve is exactly what your users get.

  • 2018started in software
  • UI + codedesign and implementation

Worked with Motorola · Ambev Tech · Rei do Pitaco · OneTool · CESAR

Brazil · Remote, hybrid or on-site

Portrait of Yan Fontão seated, in a green sweater and glasses, holding a microphone.
OPEN
TO WORK
Let’s talk
OPEN
TO WORK
Let’s talk
000

locked channel

Under NDA

Enter the code

Ask Yan for the code ↗
OPEN
TO WORK
Let’s talk
YAN FONTÃO Case studies