Drag to explore. Scroll or pinch to zoom. Open Help for keyboard controls.

Yan
OPEN
TO WORK
Let’s talk
Yan Fontão Boring view
All work

Case 047Web app and dashboard design

ÉOS Energia

A Portuguese platform for shared solar energy, with one dashboard structure adapted for administrators, producers and consumers, plus a mobile site menu.

Contribution
Product flows and interface design
Project status
Interface design · Figma archive
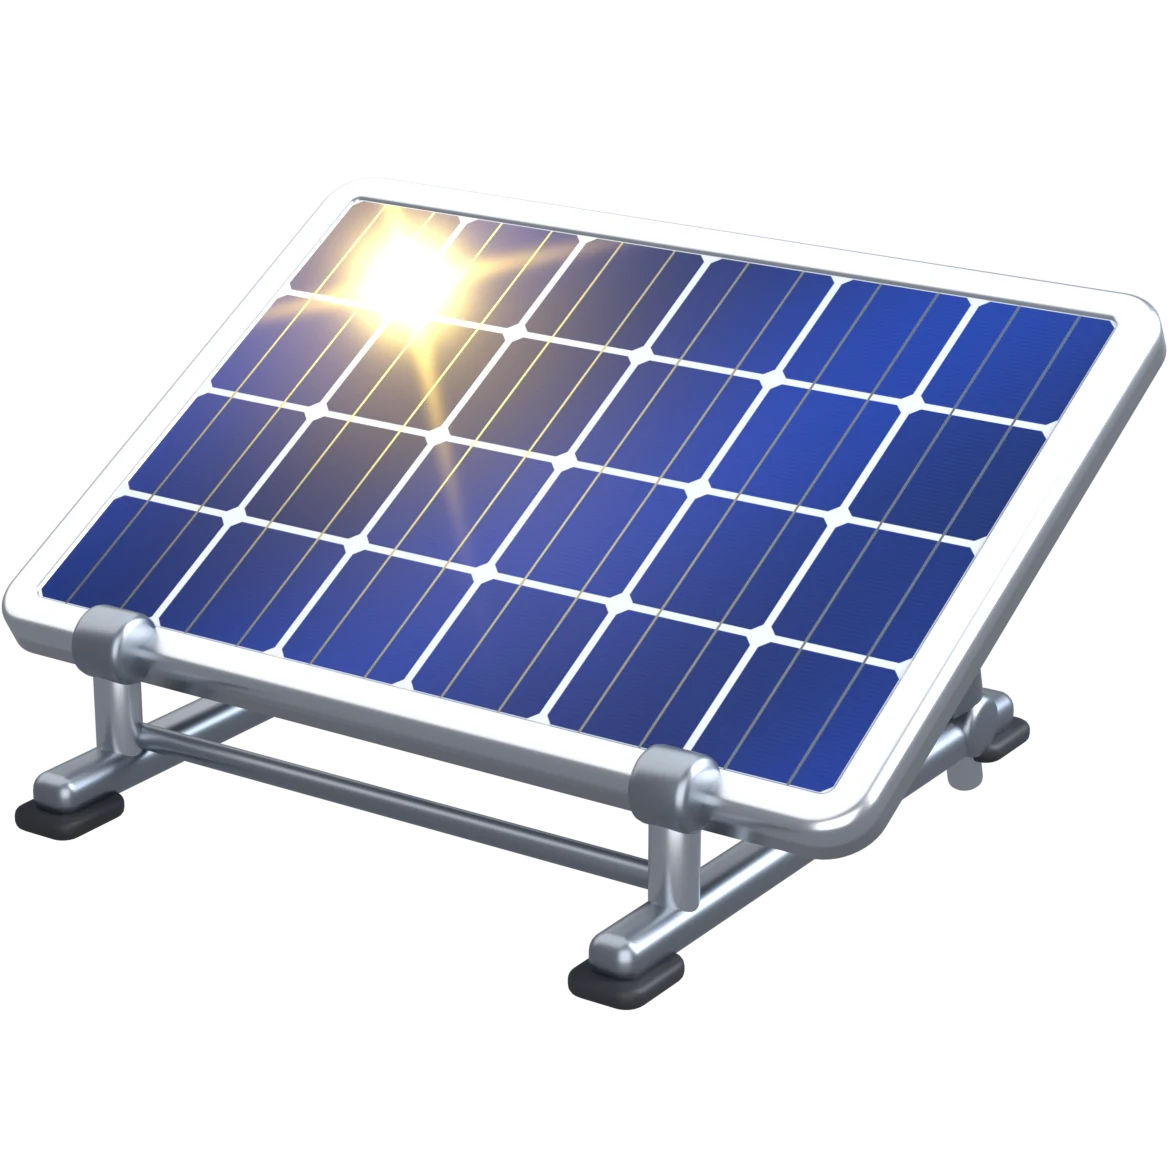
A 3D solar panel with the sun sliding across its cells.
A 3D object made for this board.

01

My contribution

ÉOS Energia is a Portuguese platform for solar plants, with the idea of shared energy in its own logo. The same dashboard exists for three roles: Administrador, Produtor and Consumidor.

The design file also covers profile, documents, invoices, chart and contract overlays, and login and pre-registration forms. The figures on these screens are sample data.
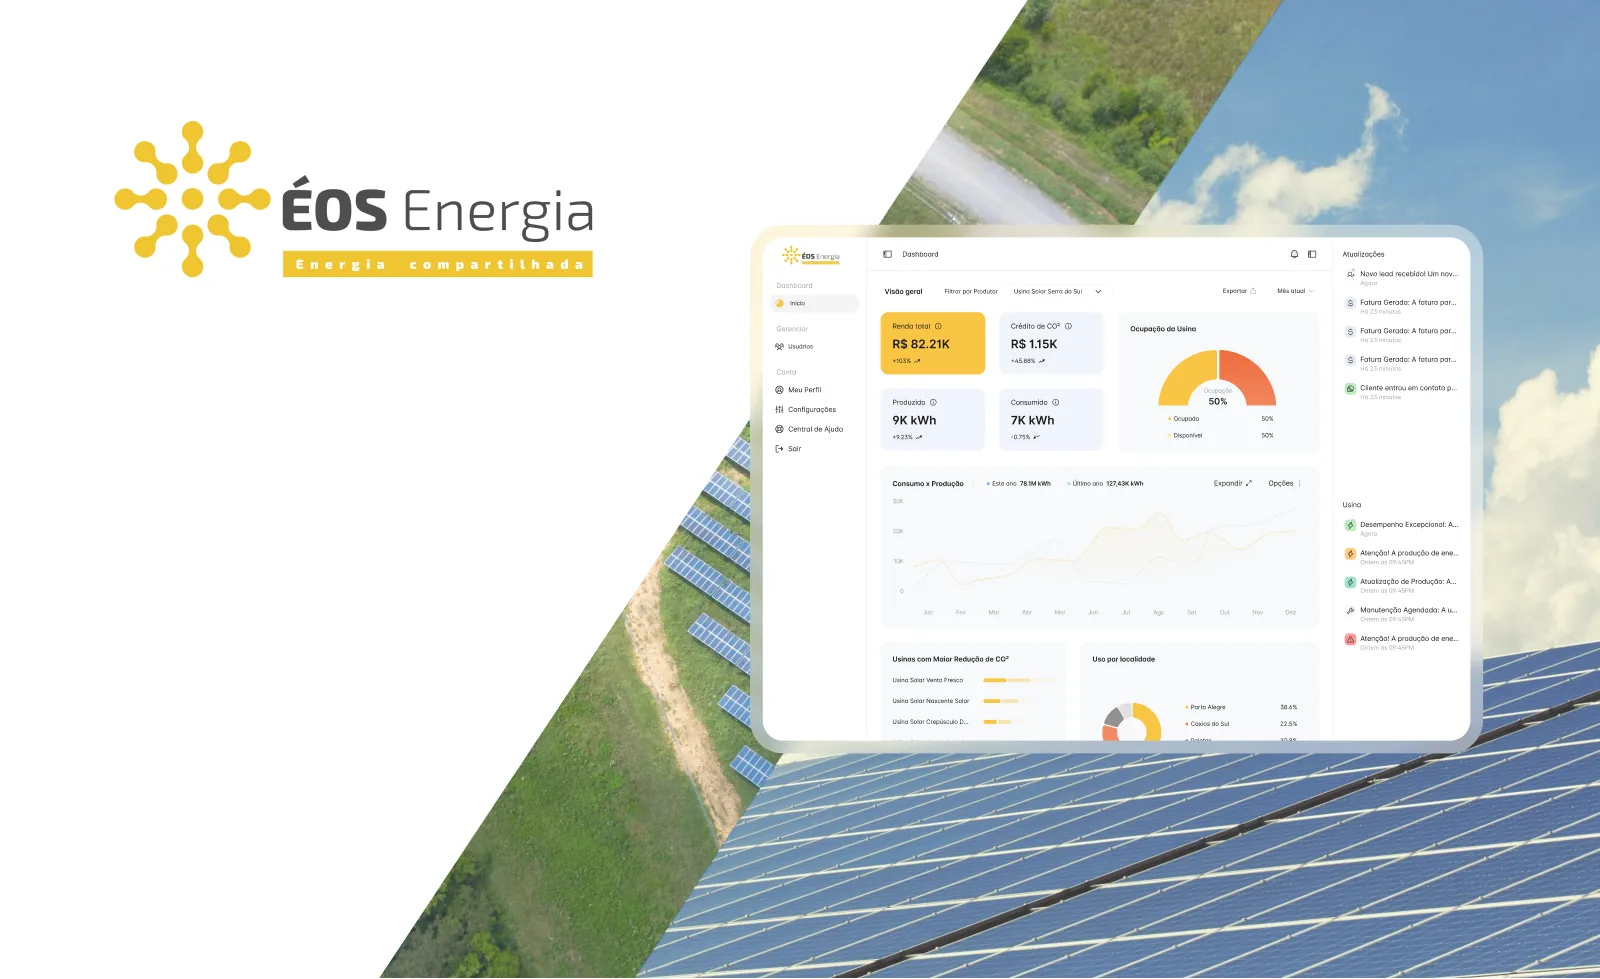
A scroll through the design: the landing page, from the promise to the numbers.
ÉOS Energia logo with the tag Energia compartilhada on white, beside diagonal photos of solar panels and sky and a framed administrator dashboard.
The administrator dashboard with the ÉOS Energia brand and its solar setting.

02

The same frame, three starting points

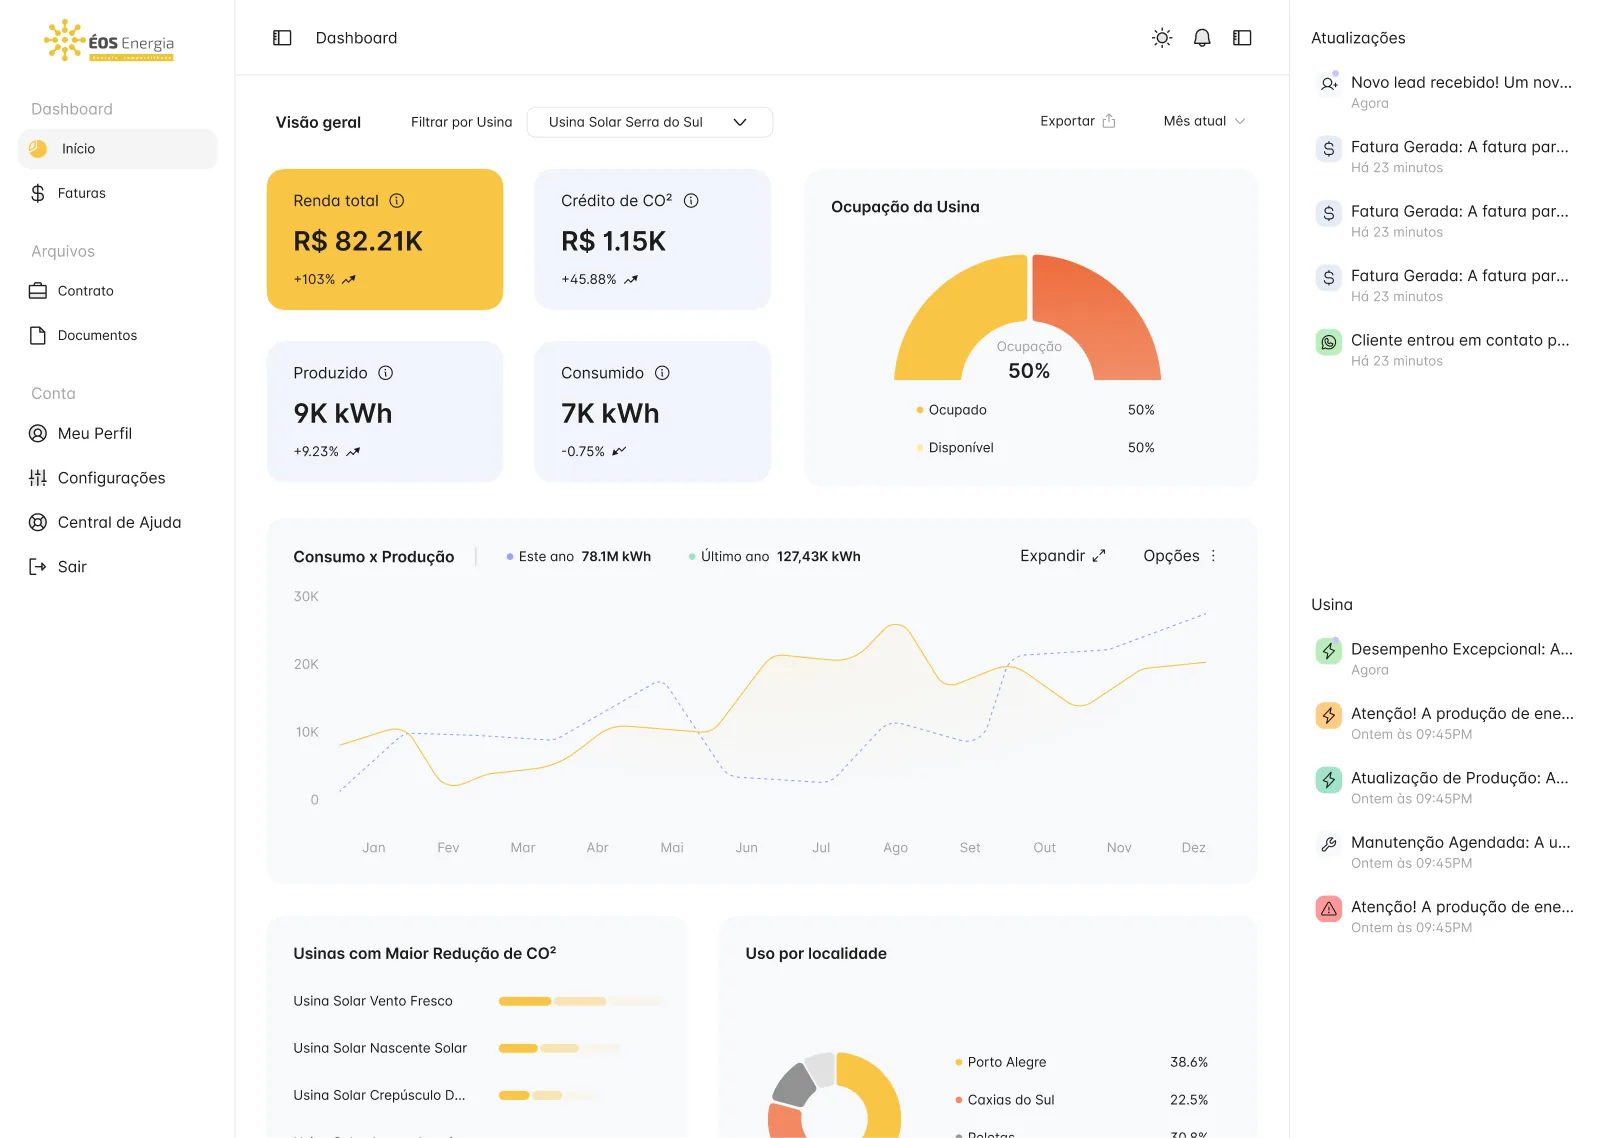
All three views share a left menu, a central overview and a right column of updates. With that frame fixed, the difference between roles shows up in what fills it: the top filter reads by producer for the administrator and by plant for the other two, and the menu changes with what each role can do.

The administrator gets Usuários under Gerenciar. The producer and the consumer get Faturas, plus Contrato and Documentos under Arquivos, so the account’s paperwork sits next to the numbers.
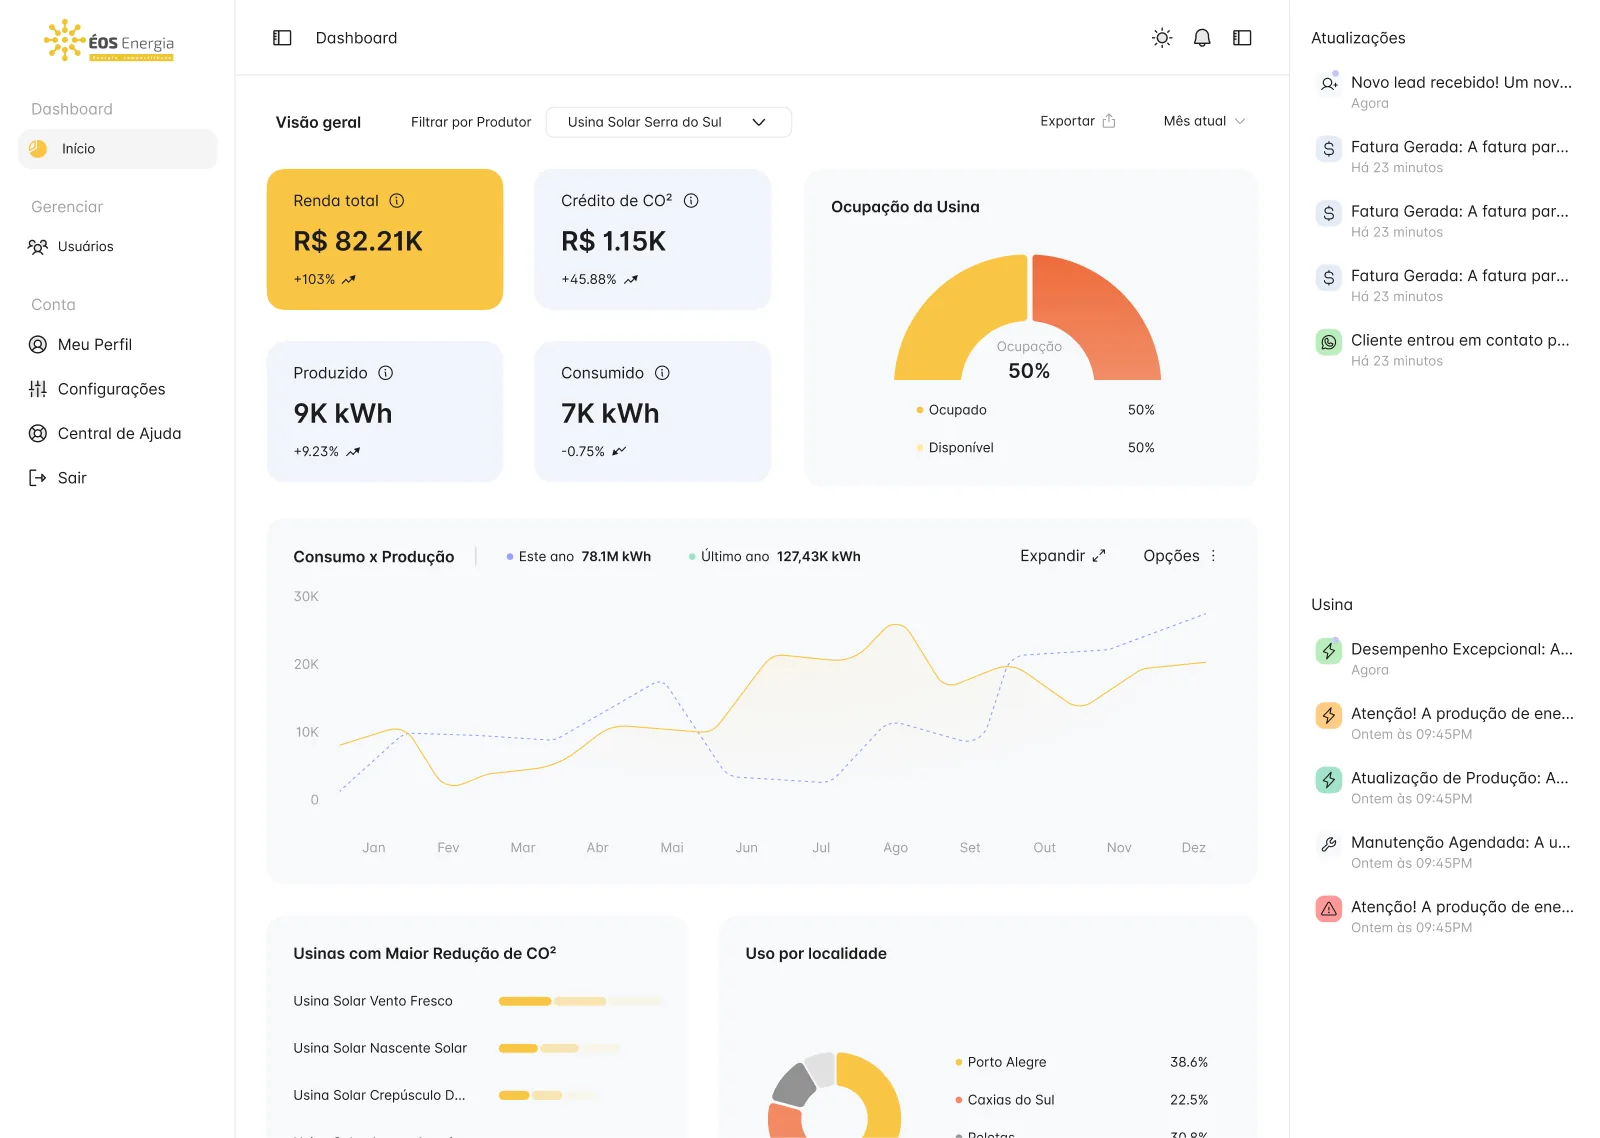
Administrator dashboard with a producer filter, tiles for income, CO² credit, production and consumption, a plant occupancy gauge, a consumption and production chart and a right column of updates.
The administrator view filters by producer and adds user management.

03

What each role reads first

For the administrator and the producer, the first block combines income, CO² credit, production and consumption beside a gauge of plant occupancy, with consumption and production compared below. One yellow tile marks the figure to read first, and the others stay pale.

The consumer view replaces income with savings and CO² reduction, drops the gauge and adds a table of plants with temperature, production and a status pill such as Em operação or Em construção. The structure stays familiar, but the question moves from what the plant earned to what the account saved and how its plants are doing.
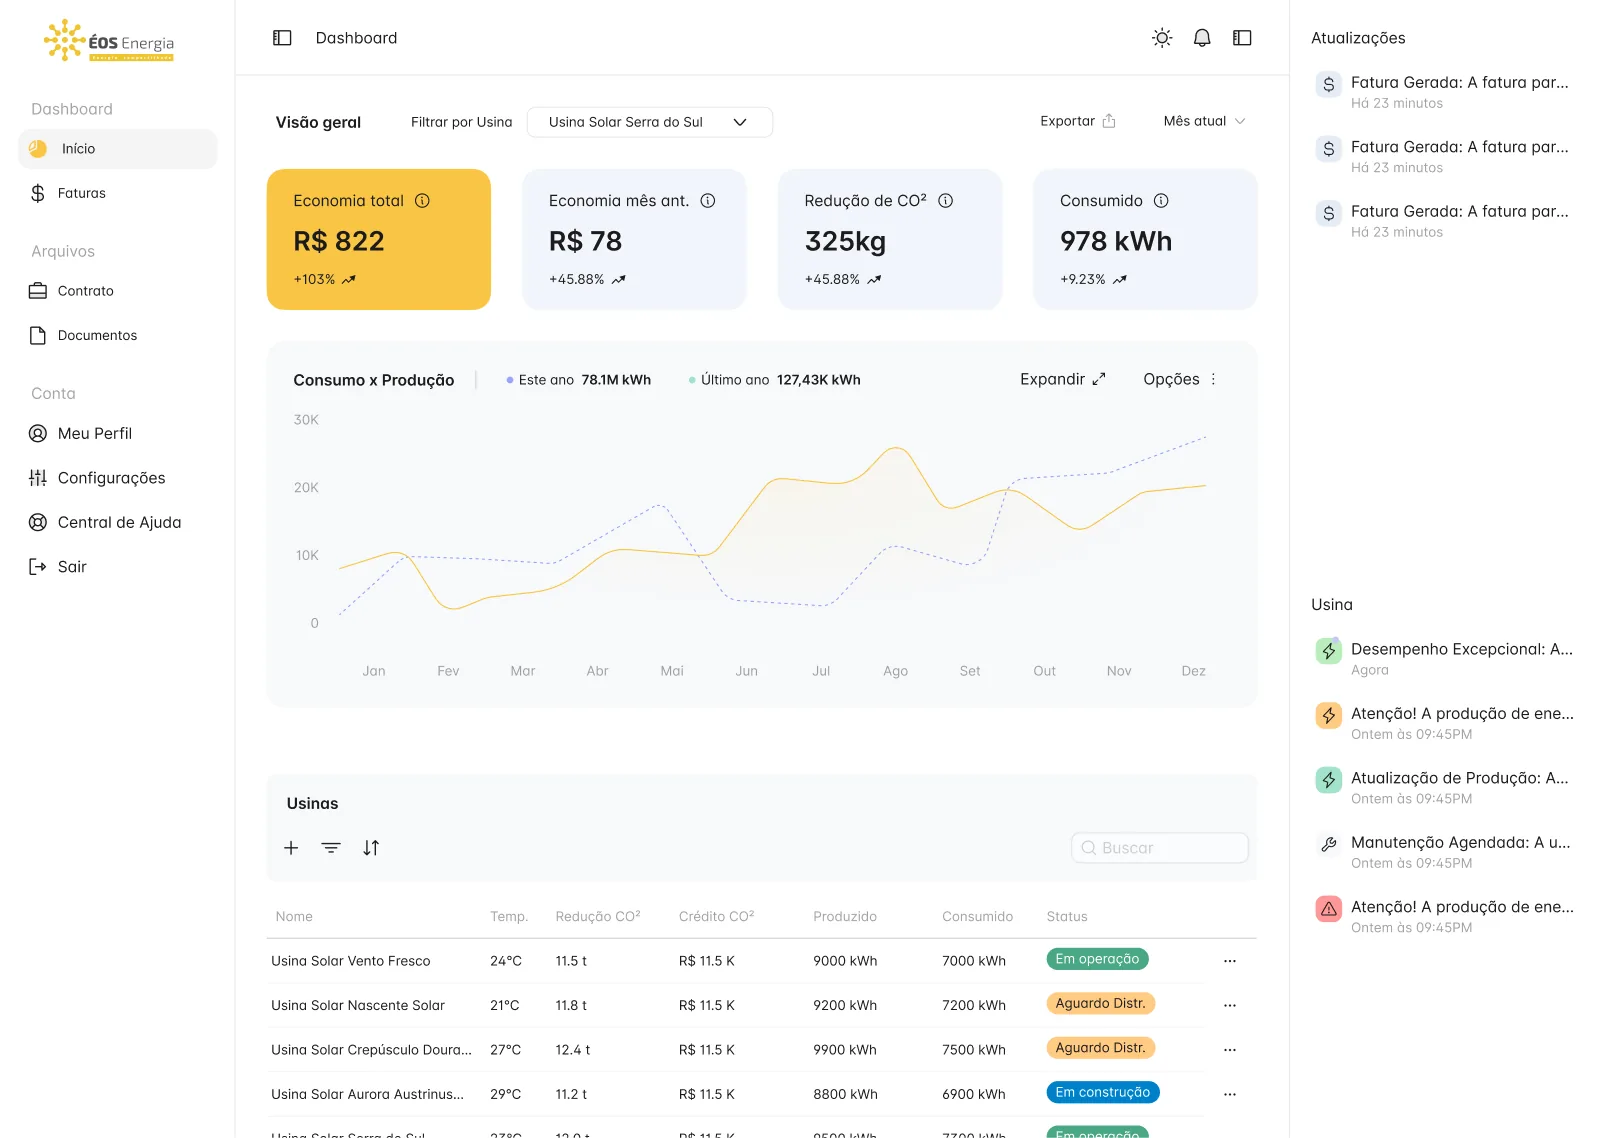
Consumer dashboard with tiles for savings, CO² reduction and consumption, the same chart and a table of plants with coloured status pills.
The consumer view reads savings and a table of plants with their status.
Producer dashboard with the same tiles and gauge as the administrator view, a plant filter and a menu with Faturas, Contrato and Documentos.
The producer view keeps the layout and adds invoices, contract and documents to the menu.

04

The site around the platform

The file also keeps several versions of the landing page. On a phone, its menu separates the main links from a Mais group, then ends with Falar com um consultor as a yellow button and a text link for existing accounts.
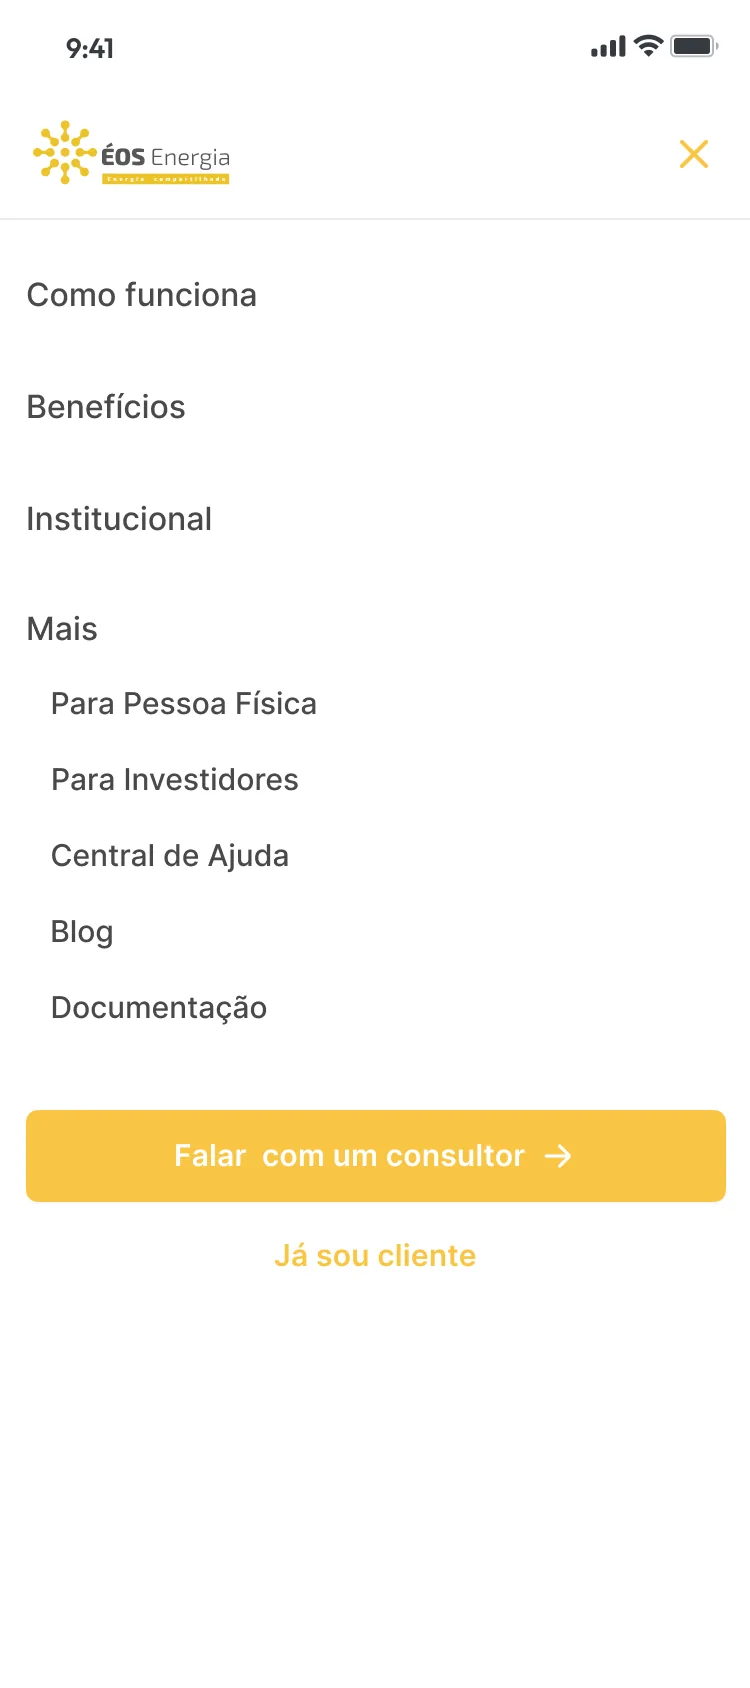

White phone menu with the ÉOS Energia logo, a close icon, three main links, a Mais group of five links, a yellow consultant button and a text link.
The site menu on a phone ends with a yellow button to talk to a consultant.
000

Instructions

Yan Fontão
Tap
Open a screen
Click
Open a screen
Drag
Look around the board
Wheel
Mouse zooms, trackpad moves, pinch zooms
− +
Pull back to see the whole board, or come closer
Arrows
In a case: ↑↓ change case, ←→ change media. On the board: move
Space
Open, or go back
Enter
Open
Esc Backspace
Back
Home
Back to the center, then the introduction
PgUp PgDn
Previous or next channel
Tab
Walk projects and links
R
Random project
0–9
Type a channel, 1–61
?
This page
Shortcuts

Music on the board

Files compressed and levelled for the web.

OPEN
TO WORK
Let’s talk

New message to Yan

Tell me who you are and I’ll get back to you.

000

About Yan

Hello, I’m Yan

Product Designer/ Design Engineer

Most products lose something between design and code. Mine don’t: I research the problem, design the product and ship the interface myself, so what you approve is exactly what your users get.

  • 2018started in software
  • UI + codedesign and implementation

Worked with Motorola · Ambev Tech · Rei do Pitaco · OneTool · CESAR

Brazil · Remote, hybrid or on-site

Portrait of Yan Fontão seated, in a green sweater and glasses, holding a microphone.
OPEN
TO WORK
Let’s talk
OPEN
TO WORK
Let’s talk
000

locked channel

Under NDA

Enter the code

Ask Yan for the code ↗
OPEN
TO WORK
Let’s talk
YAN FONTÃO Case studies

Channel 47 Web app and dashboard design

ÉOS Energia

A Portuguese platform for shared solar energy, with one dashboard structure adapted for administrators, producers and consumers, plus a mobile site menu.

Contribution
Product flows and interface design
Project status
Interface design · Figma archive
A 3D solar panel with the sun sliding across its cells.
A 3D object made for this board.

One dashboard, read from three sides of solar energy

Screens from the original Figma design file, with sample data.

My contribution

ÉOS Energia is a Portuguese platform for solar plants, with the idea of shared energy in its own logo. The same dashboard exists for three roles: Administrador, Produtor and Consumidor.

The design file also covers profile, documents, invoices, chart and contract overlays, and login and pre-registration forms. The figures on these screens are sample data.

A scroll through the design: the landing page, from the promise to the numbers.
ÉOS Energia logo with the tag Energia compartilhada on white, beside diagonal photos of solar panels and sky and a framed administrator dashboard.
The administrator dashboard with the ÉOS Energia brand and its solar setting.

The same frame, three starting points

All three views share a left menu, a central overview and a right column of updates. With that frame fixed, the difference between roles shows up in what fills it: the top filter reads by producer for the administrator and by plant for the other two, and the menu changes with what each role can do.

The administrator gets Usuários under Gerenciar. The producer and the consumer get Faturas, plus Contrato and Documentos under Arquivos, so the account’s paperwork sits next to the numbers.

Administrator dashboard with a producer filter, tiles for income, CO² credit, production and consumption, a plant occupancy gauge, a consumption and production chart and a right column of updates.
The administrator view filters by producer and adds user management.

What each role reads first

For the administrator and the producer, the first block combines income, CO² credit, production and consumption beside a gauge of plant occupancy, with consumption and production compared below. One yellow tile marks the figure to read first, and the others stay pale.

The consumer view replaces income with savings and CO² reduction, drops the gauge and adds a table of plants with temperature, production and a status pill such as Em operação or Em construção. The structure stays familiar, but the question moves from what the plant earned to what the account saved and how its plants are doing.

Consumer dashboard with tiles for savings, CO² reduction and consumption, the same chart and a table of plants with coloured status pills.
The consumer view reads savings and a table of plants with their status.
Producer dashboard with the same tiles and gauge as the administrator view, a plant filter and a menu with Faturas, Contrato and Documentos.
The producer view keeps the layout and adds invoices, contract and documents to the menu.

The site around the platform

The file also keeps several versions of the landing page. On a phone, its menu separates the main links from a Mais group, then ends with Falar com um consultor as a yellow button and a text link for existing accounts.

White phone menu with the ÉOS Energia logo, a close icon, three main links, a Mais group of five links, a yellow consultant button and a text link.
The site menu on a phone ends with a yellow button to talk to a consultant.