Drag to explore. Scroll or pinch to zoom. Open Help for keyboard controls.

Yan
OPEN
TO WORK
Let’s talk
Yan Fontão Boring view
All work

Case 045Web app and dashboard design

Orka

An admin dashboard in Portuguese for equipment that reports water readings, with an overview, a filterable list and a detail screen for each unit.

Contribution
Interface design
Project status
Interface design · Figma archive
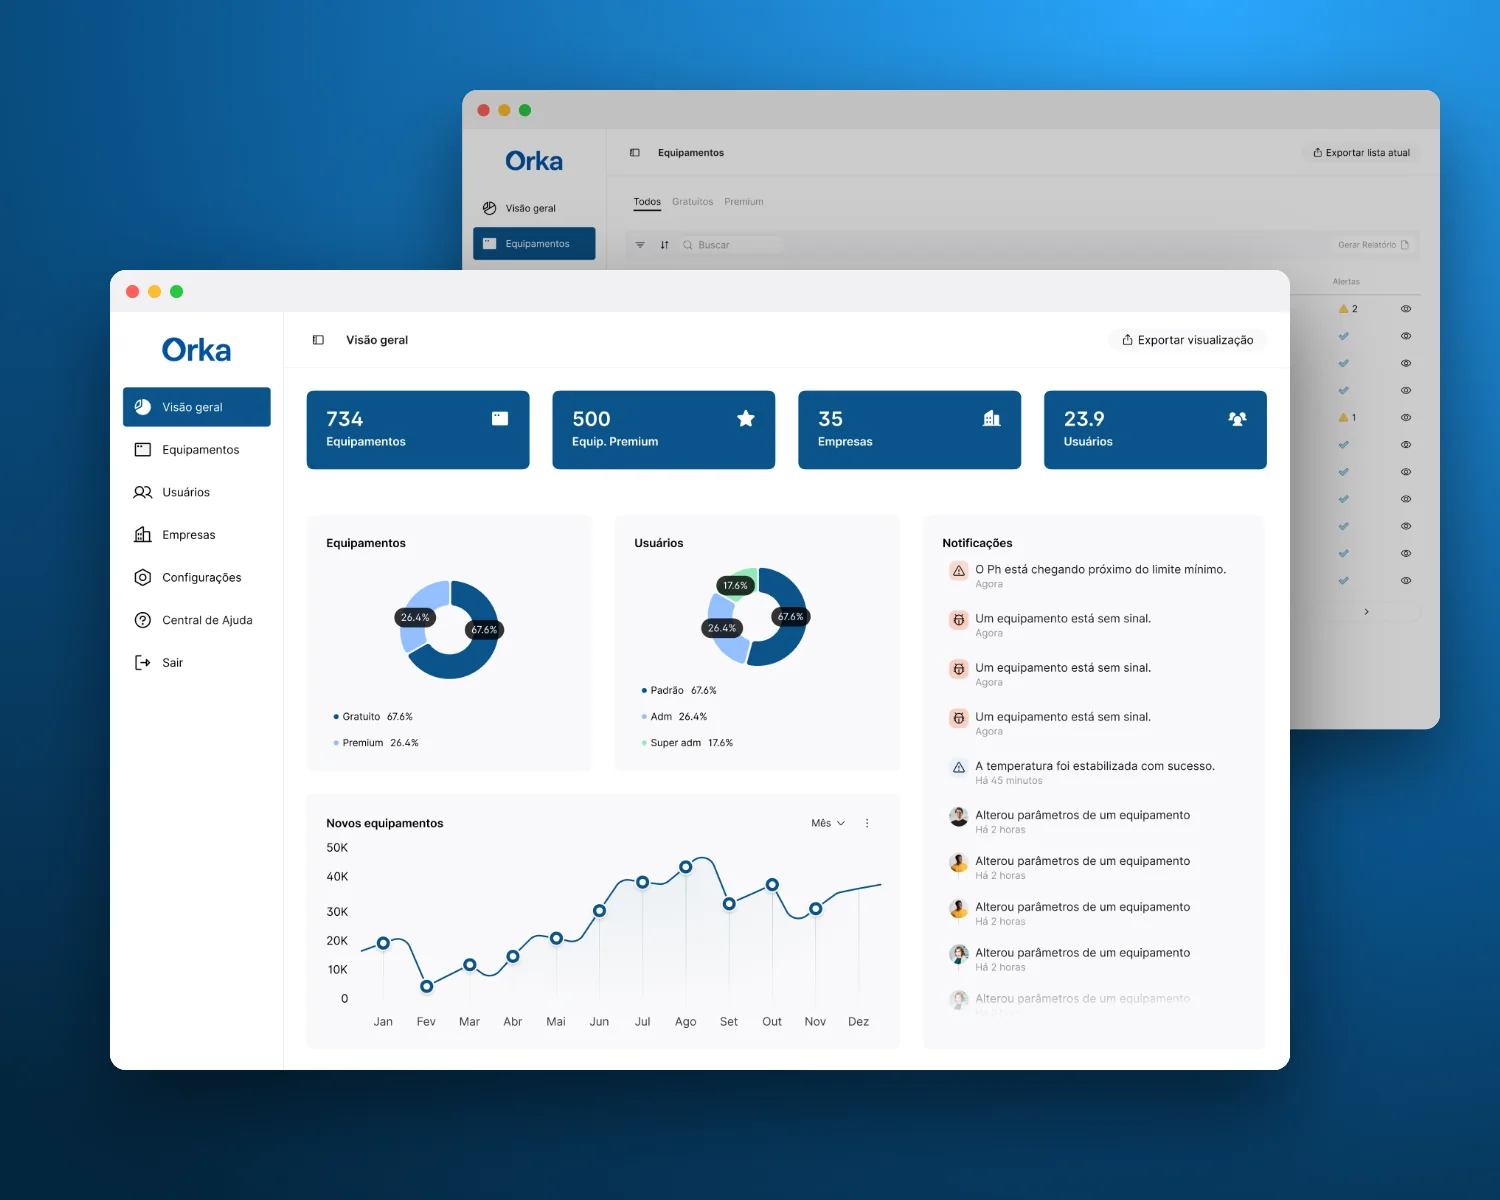
Mockup of Orka composed for this board from real screens of the project.
Mockup composed for this board from real project screens.

01

My contribution

Orka is a desktop admin dashboard in Portuguese for managing equipment, the people who use it and the companies it belongs to. The units report water readings such as pH, ORP and temperature.

Three screens carry the structure: an overview, the equipment list and the detail of one unit. Every value on them is sample data.
Recorded from the Figma prototype. From the overview to one piece of equipment, reports and settings.
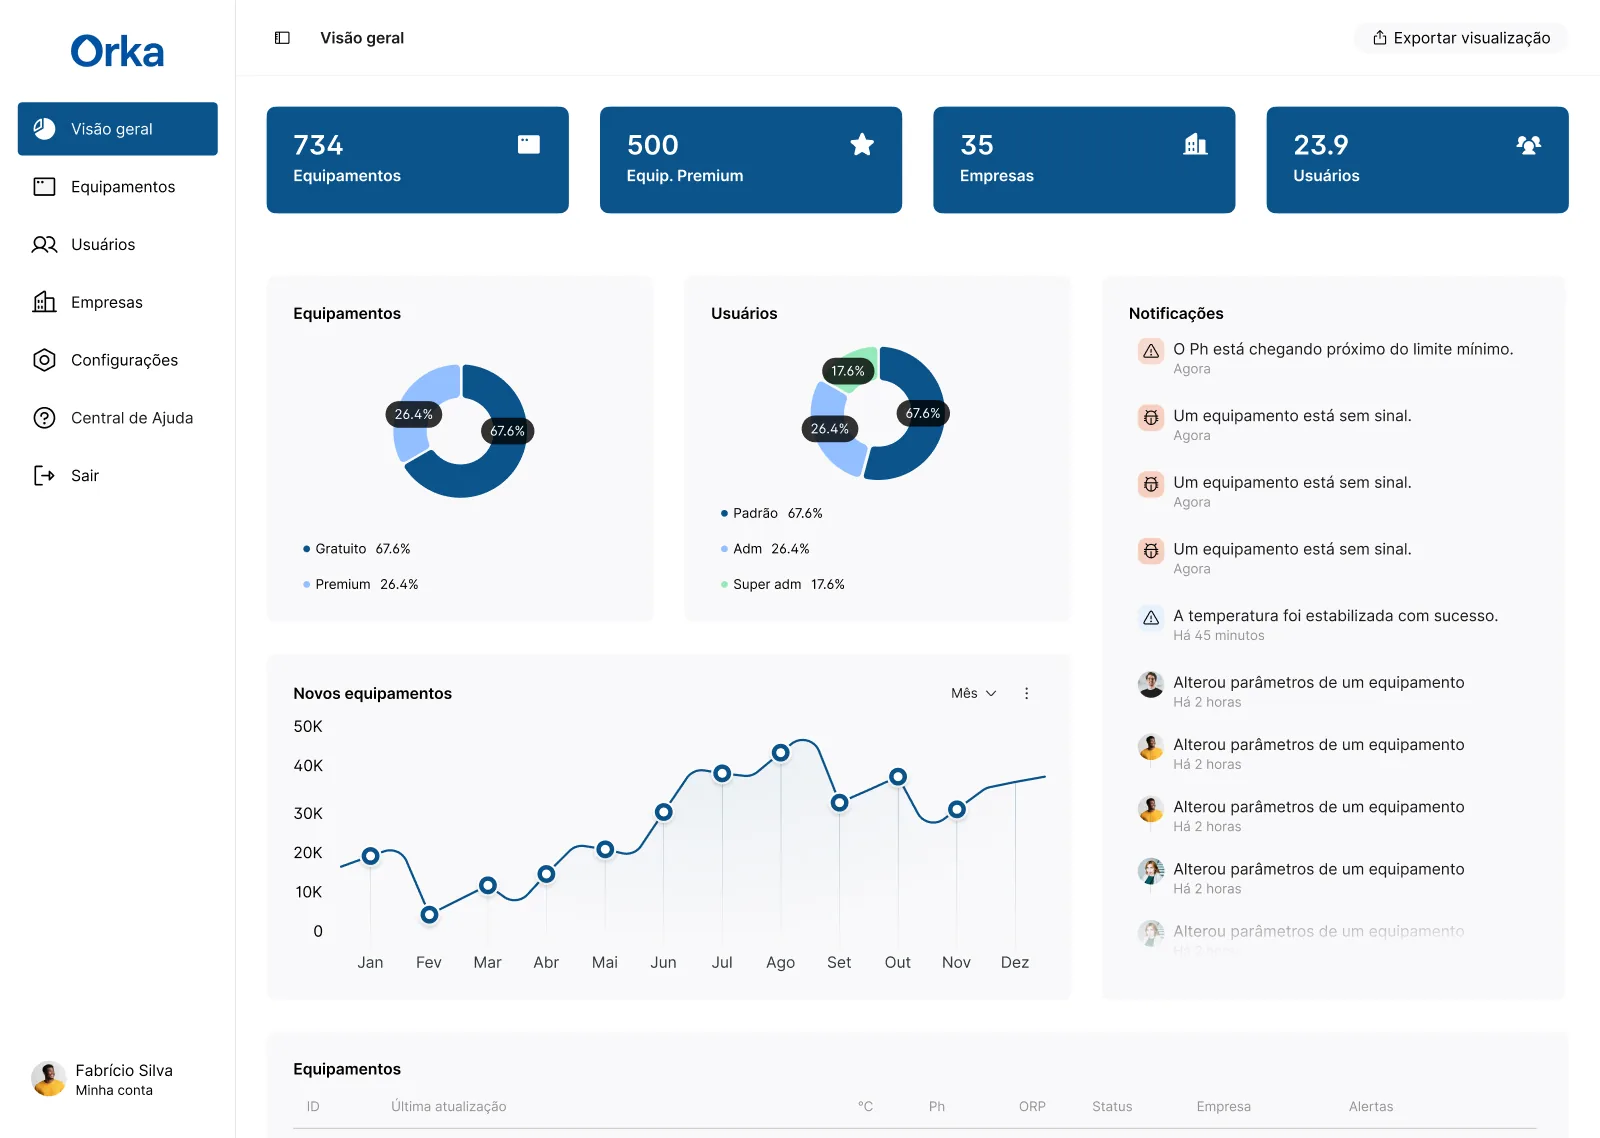
Orka overview with a sidebar, four blue total tiles, donut charts for equipment and users, a notifications column and a line chart of new equipment.
The overview keeps totals, distribution and recent events on one screen.

02

Totals first, recent events close by

The overview opens with four blue tiles for equipment, premium equipment, companies and users. Below them, two charts split equipment by plan and users by access level, and a line chart follows new equipment across the year.

Notifications take their own column, so events such as a pH close to its limit or a unit without signal stay on this screen instead of on another page. A short version of the list begins at the bottom of the same screen.
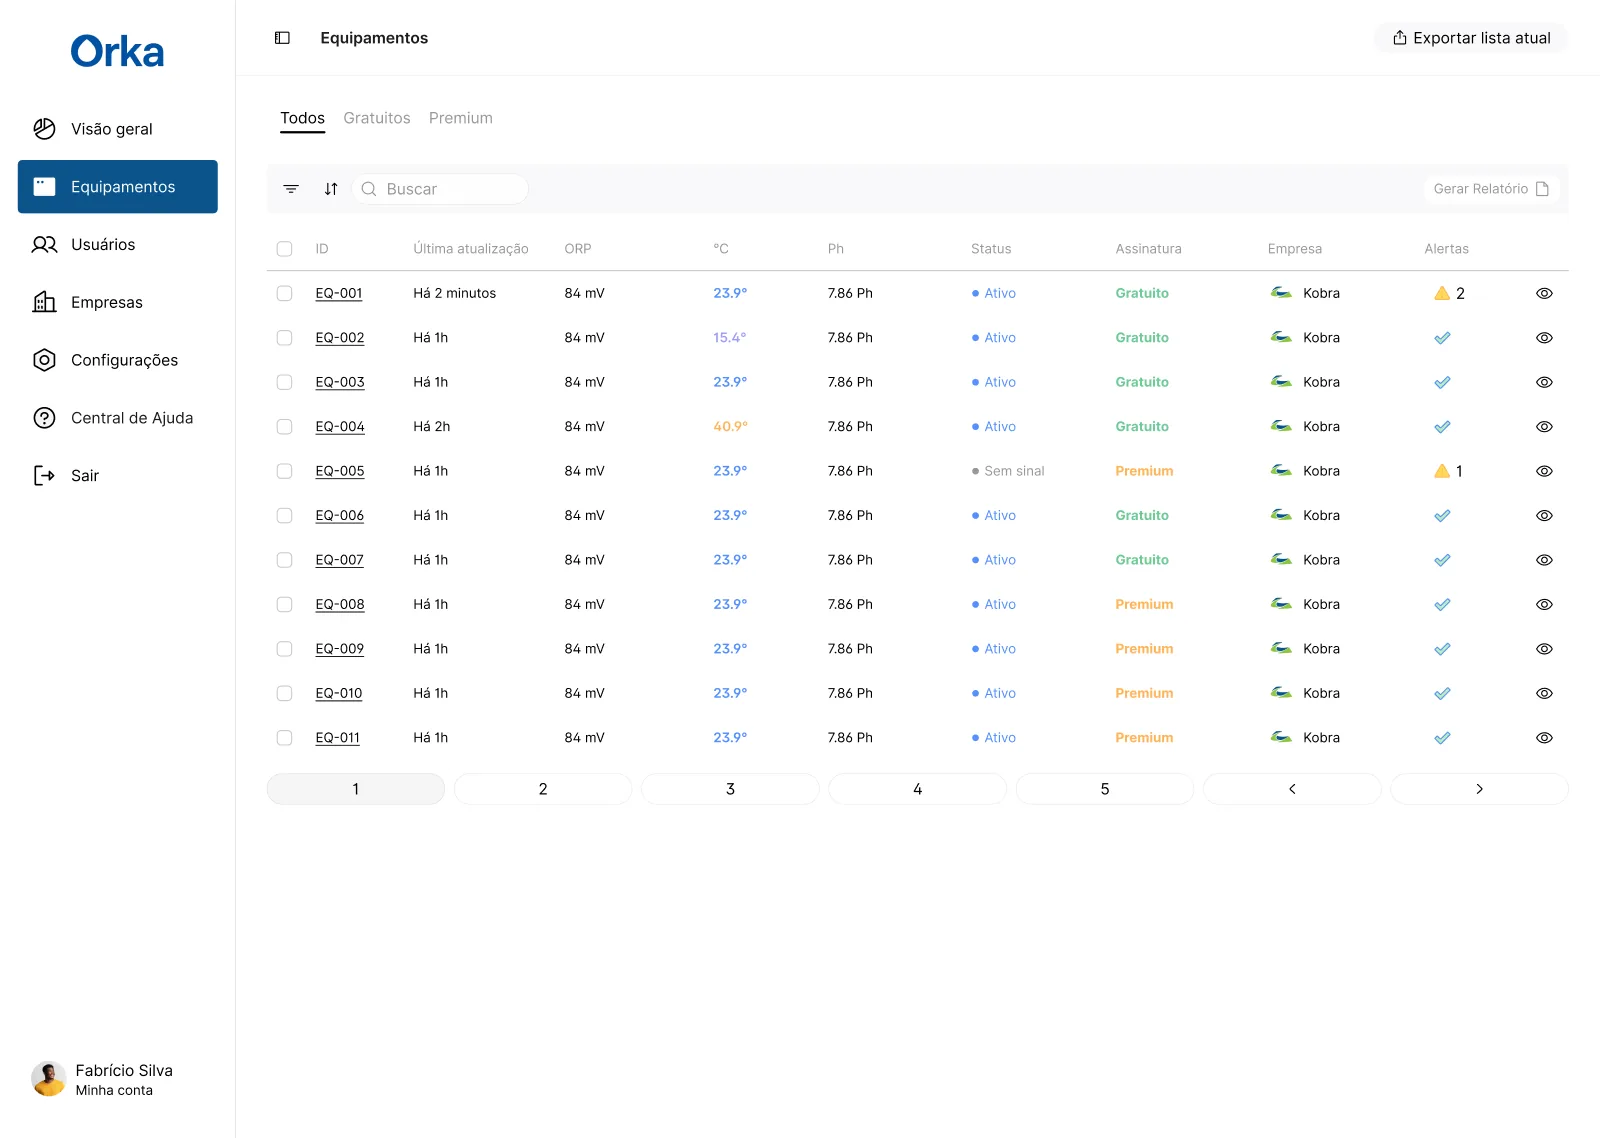
Equipamentos list with tabs, filter and search, and rows coded EQ-001 to EQ-011 showing readings, status, plan, company and alerts.
Colour and alert icons make exceptions visible while scanning the list.
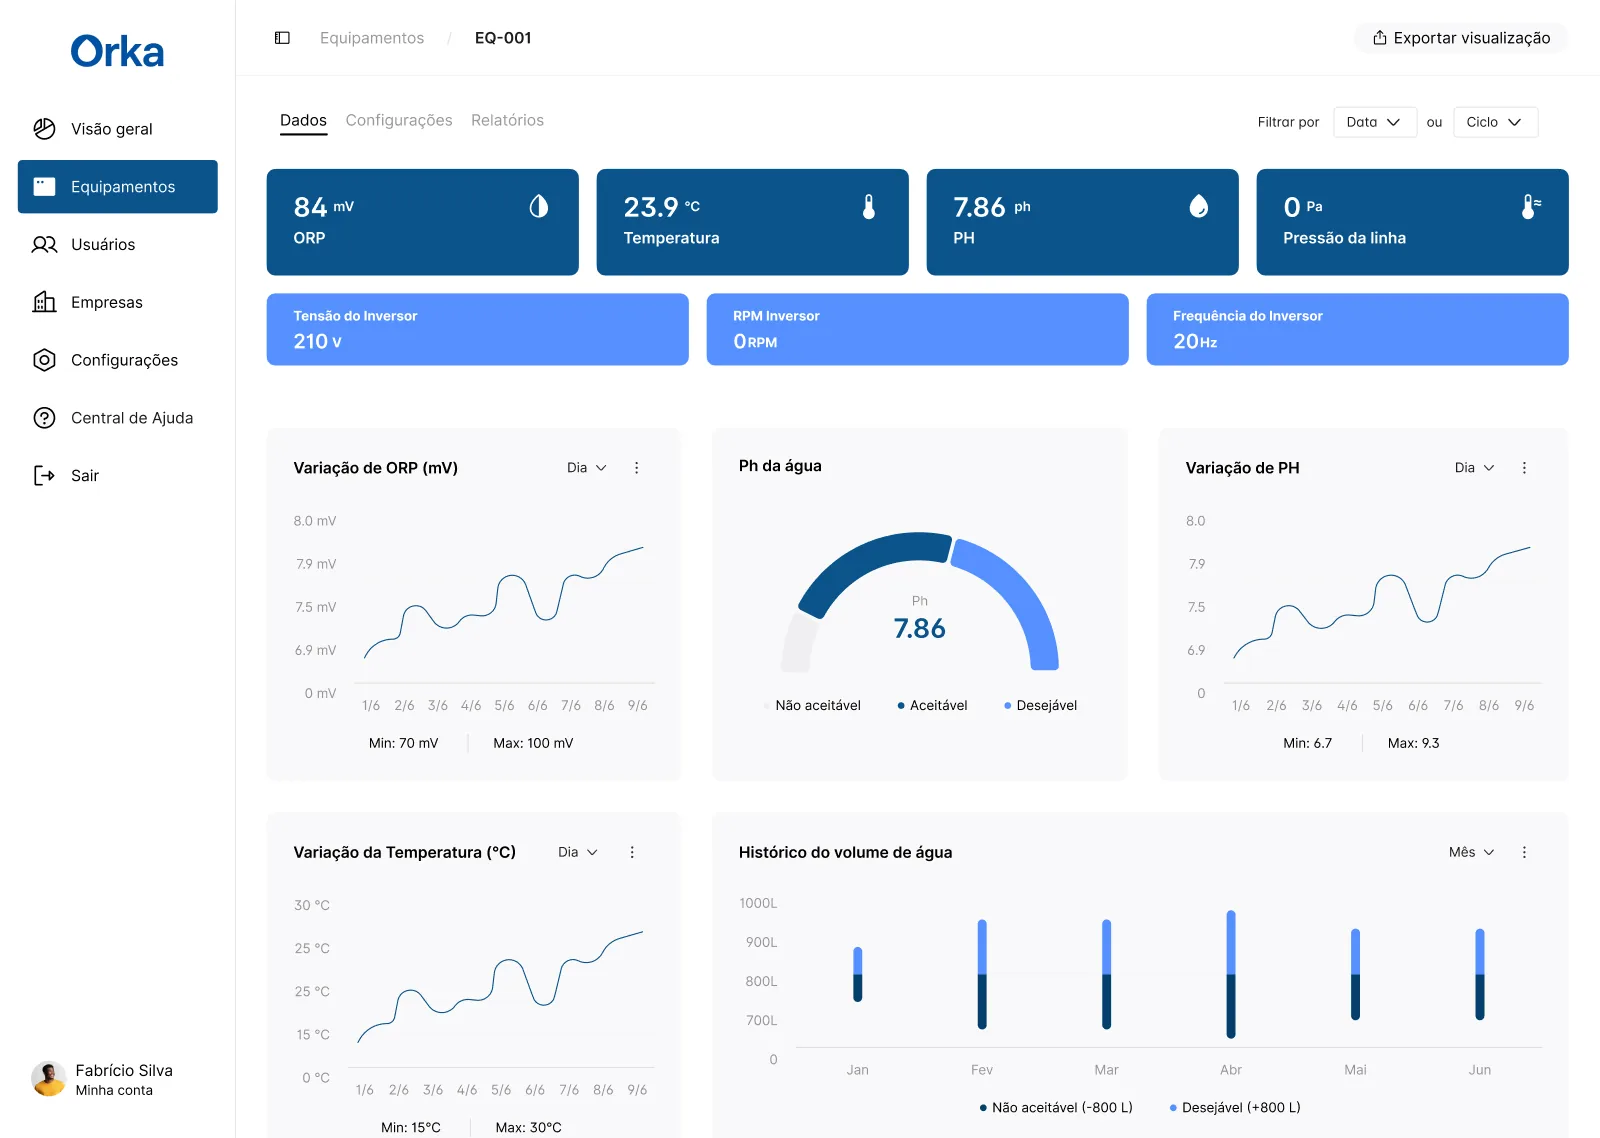
Detail of unit EQ-001 with blue reading tiles, a row of inverter values, line charts, a pH gauge and a water volume chart.
One unit: current readings first, then how each one varied.

03

From the list to one unit

The list is built for scanning. Tabs separate all, free and premium equipment, and each row puts the latest readings, status, plan, company and alerts on one line. Temperature changes colour with its level and an alert shows as a triangle with a count, so the exceptions stand out.

The detail screen keeps the overview’s order for a single unit: current readings in the large tiles, inverter values in a lighter row, then charts of how each reading varied, with its minimum and maximum. The pH gauge marks ranges as not acceptable, acceptable and desirable, which turns a number into a judgement.
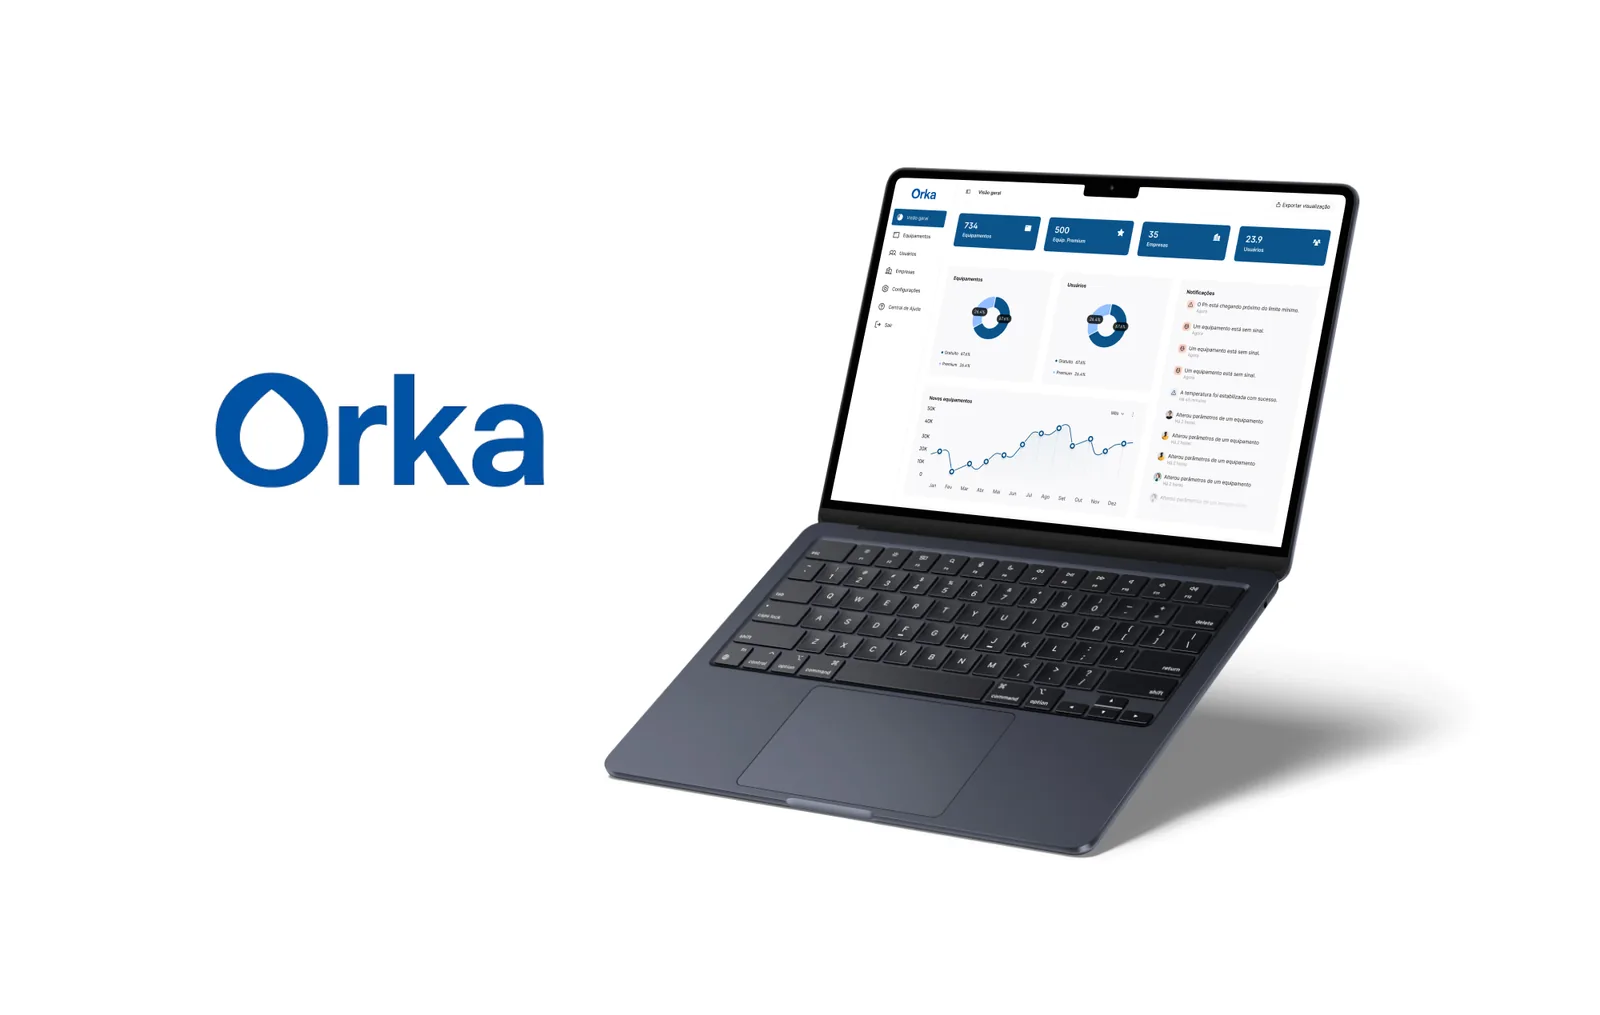
Large blue Orka logo beside a dark laptop showing the overview screen, on a white background.
Presentation frame with the Orka logo and the overview screen.
000

Instructions

Yan Fontão
Tap
Open a screen
Click
Open a screen
Drag
Look around the board
Wheel
Mouse zooms, trackpad moves, pinch zooms
− +
Pull back to see the whole board, or come closer
Arrows
In a case: ↑↓ change case, ←→ change media. On the board: move
Space
Open, or go back
Enter
Open
Esc Backspace
Back
Home
Back to the center, then the introduction
PgUp PgDn
Previous or next channel
Tab
Walk projects and links
R
Random project
0–9
Type a channel, 1–61
?
This page
Shortcuts

Music on the board

Files compressed and levelled for the web.

OPEN
TO WORK
Let’s talk

New message to Yan

Tell me who you are and I’ll get back to you.

000

About Yan

Hello, I’m Yan

Product Designer/ Design Engineer

Most products lose something between design and code. Mine don’t: I research the problem, design the product and ship the interface myself, so what you approve is exactly what your users get.

  • 2018started in software
  • UI + codedesign and implementation

Worked with Motorola · Ambev Tech · Rei do Pitaco · OneTool · CESAR

Brazil · Remote, hybrid or on-site

Portrait of Yan Fontão seated, in a green sweater and glasses, holding a microphone.
OPEN
TO WORK
Let’s talk
OPEN
TO WORK
Let’s talk
000

locked channel

Under NDA

Enter the code

Ask Yan for the code ↗
OPEN
TO WORK
Let’s talk
YAN FONTÃO Case studies

Channel 45 Web app and dashboard design

Orka

An admin dashboard in Portuguese for equipment that reports water readings, with an overview, a filterable list and a detail screen for each unit.

Contribution
Interface design
Project status
Interface design · Figma archive
Mockup of Orka composed for this board from real screens of the project.
Mockup composed for this board from real project screens.

From the whole equipment base to a single reading

Screens from the original Figma design file, with sample data.

My contribution

Orka is a desktop admin dashboard in Portuguese for managing equipment, the people who use it and the companies it belongs to. The units report water readings such as pH, ORP and temperature.

Three screens carry the structure: an overview, the equipment list and the detail of one unit. Every value on them is sample data.

Recorded from the Figma prototype. From the overview to one piece of equipment, reports and settings.
Orka overview with a sidebar, four blue total tiles, donut charts for equipment and users, a notifications column and a line chart of new equipment.
The overview keeps totals, distribution and recent events on one screen.

Totals first, recent events close by

The overview opens with four blue tiles for equipment, premium equipment, companies and users. Below them, two charts split equipment by plan and users by access level, and a line chart follows new equipment across the year.

Notifications take their own column, so events such as a pH close to its limit or a unit without signal stay on this screen instead of on another page. A short version of the list begins at the bottom of the same screen.

Equipamentos list with tabs, filter and search, and rows coded EQ-001 to EQ-011 showing readings, status, plan, company and alerts.
Colour and alert icons make exceptions visible while scanning the list.
Detail of unit EQ-001 with blue reading tiles, a row of inverter values, line charts, a pH gauge and a water volume chart.
One unit: current readings first, then how each one varied.

From the list to one unit

The list is built for scanning. Tabs separate all, free and premium equipment, and each row puts the latest readings, status, plan, company and alerts on one line. Temperature changes colour with its level and an alert shows as a triangle with a count, so the exceptions stand out.

The detail screen keeps the overview’s order for a single unit: current readings in the large tiles, inverter values in a lighter row, then charts of how each reading varied, with its minimum and maximum. The pH gauge marks ranges as not acceptable, acceptable and desirable, which turns a number into a judgement.

Large blue Orka logo beside a dark laptop showing the overview screen, on a white background.
Presentation frame with the Orka logo and the overview screen.