 YAN
Mobile app design
TerasApp. A farm sensor, readable from a phone
A mobile app for TERAS IoT temperature sensors on farms: pairing devices, reading the latest temperature, following sensor records and exporting reports. All readings are sample data.
- Contribution
- Product flows and interface design
- Project status
- Interface design · Figma archive

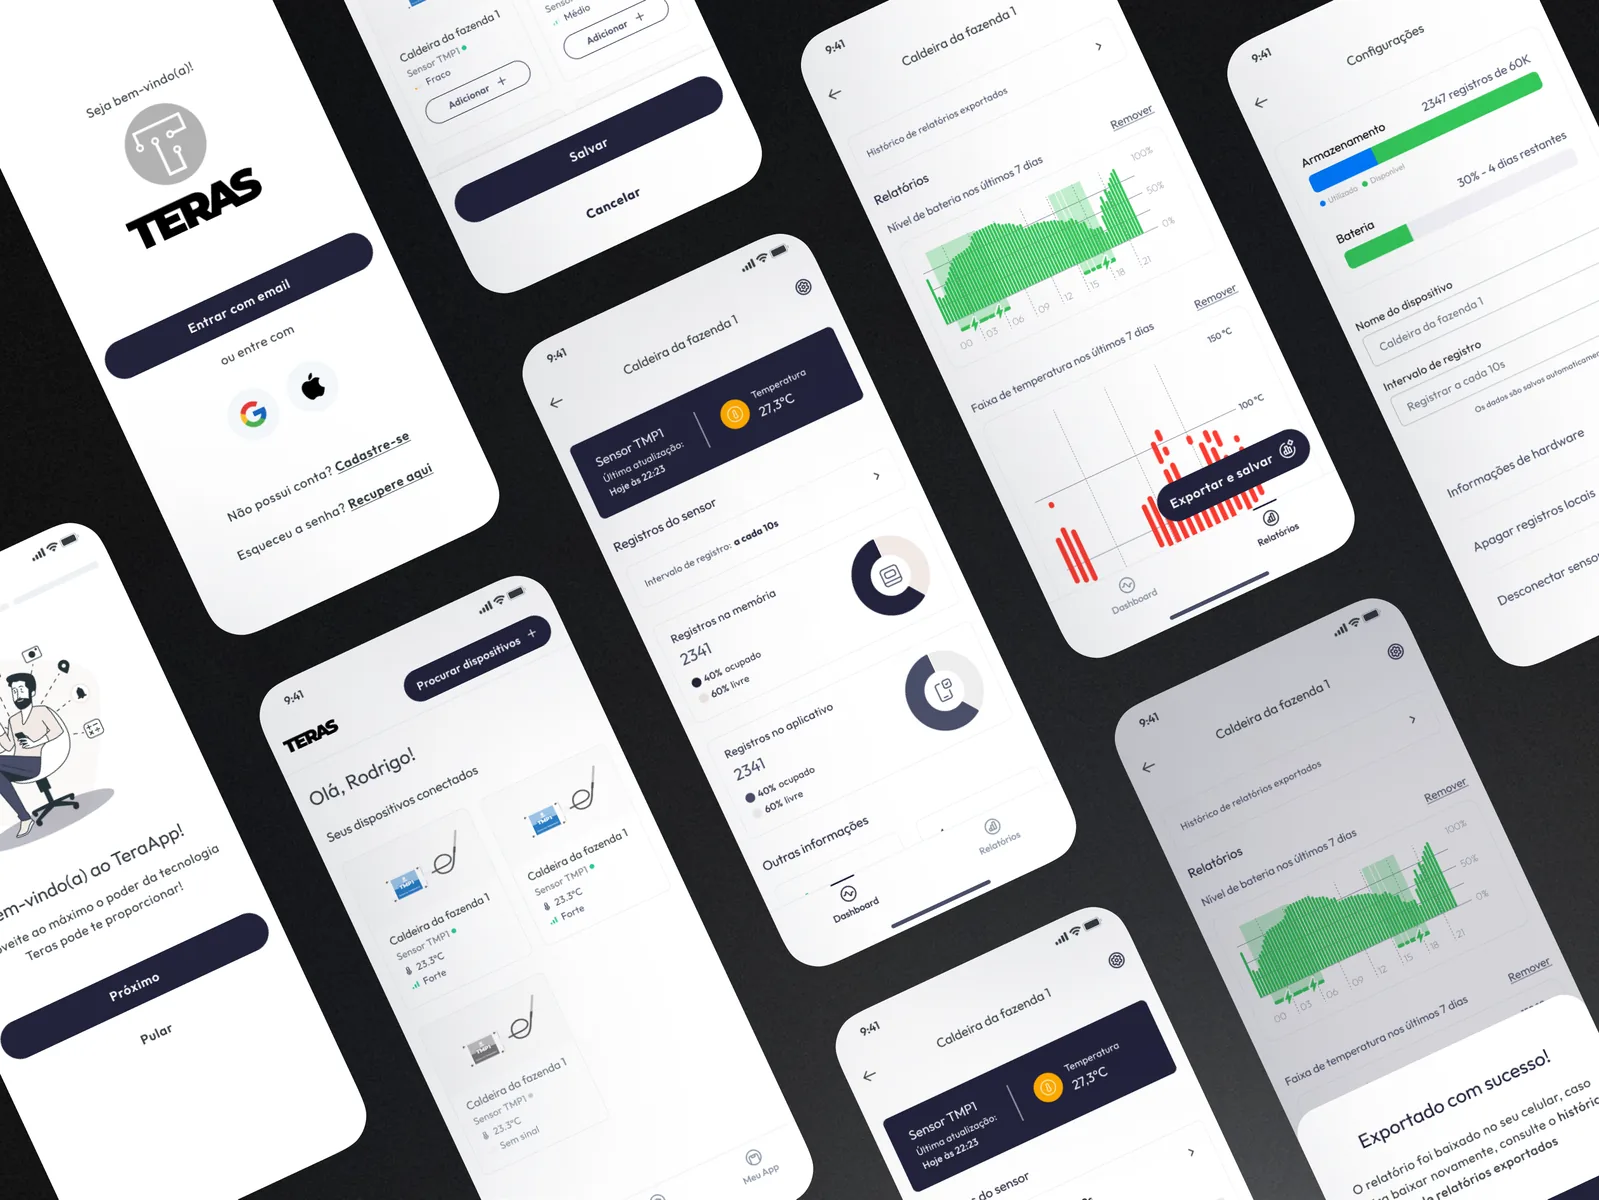
Screens from the original design in Figma and Dribbble, with sample data.
My contribution
TerasApp is the Portuguese-language companion to TERAS temperature sensors. Each sensor gets a name, such as the sample “Caldeira da fazenda 1”, and the app is built around three checks: the latest reading, the state of the sensor and how the temperature behaved over the last seven days.
The Figma file keeps the whole chain, from low-fi wireframes (onboarding, access, home, pairing, device) to a prototype of 31 mobile frames and the components behind it. Here I focus on the screens that carry those three checks.
The reading comes first
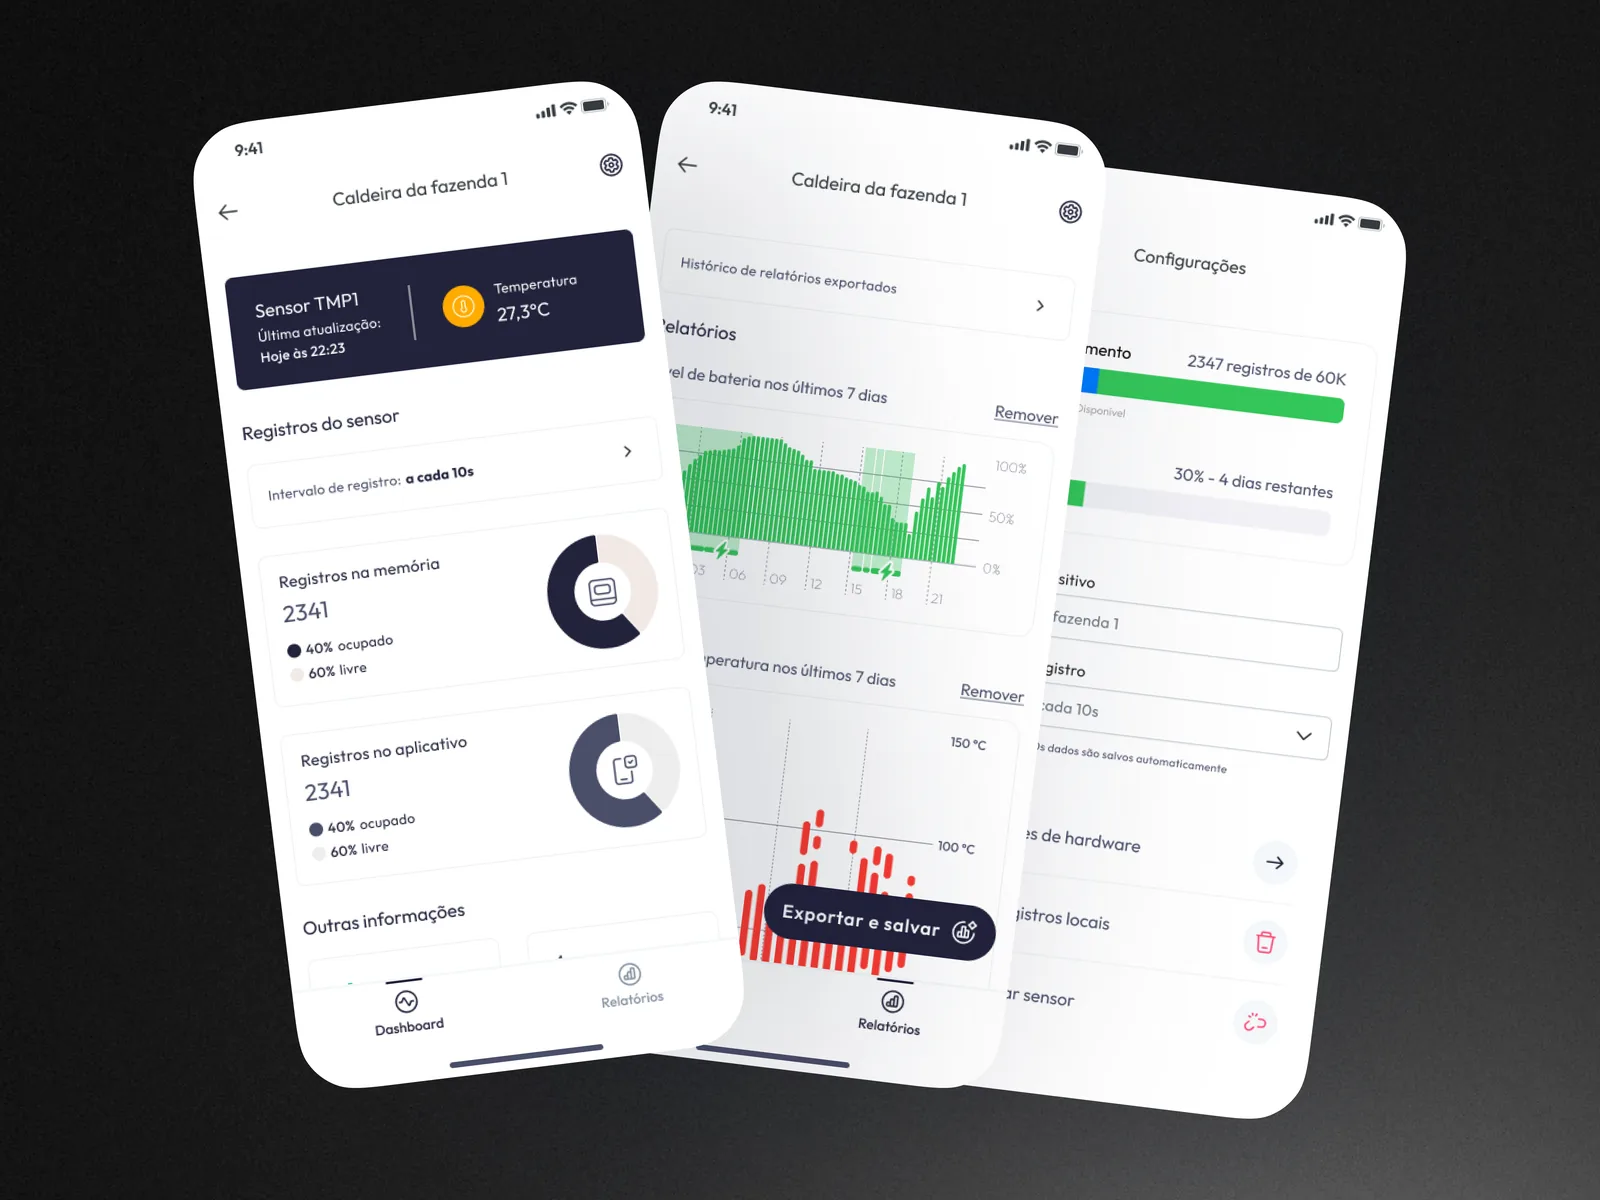
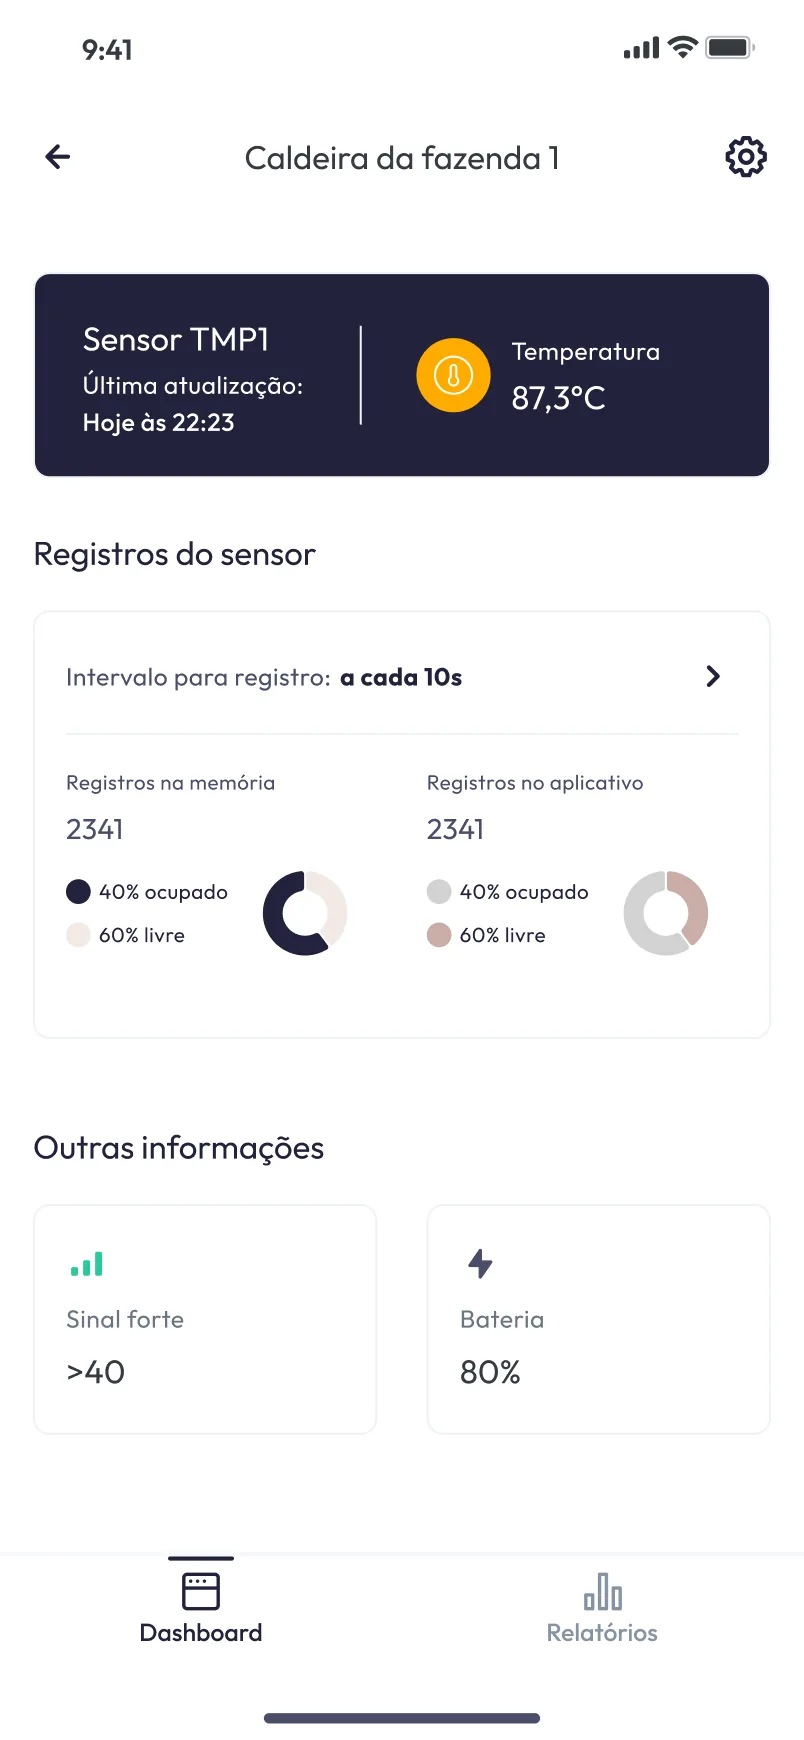
The device page opens with a dark card holding the sensor’s name, the time of the last update and the temperature, the one block on the page with strong contrast. Below it come the logging interval and the records stored in memory and in the app, then signal and battery. Read from top to bottom, the screen goes from the number to the state of the sensor behind it.
Seven days of temperature in one chart
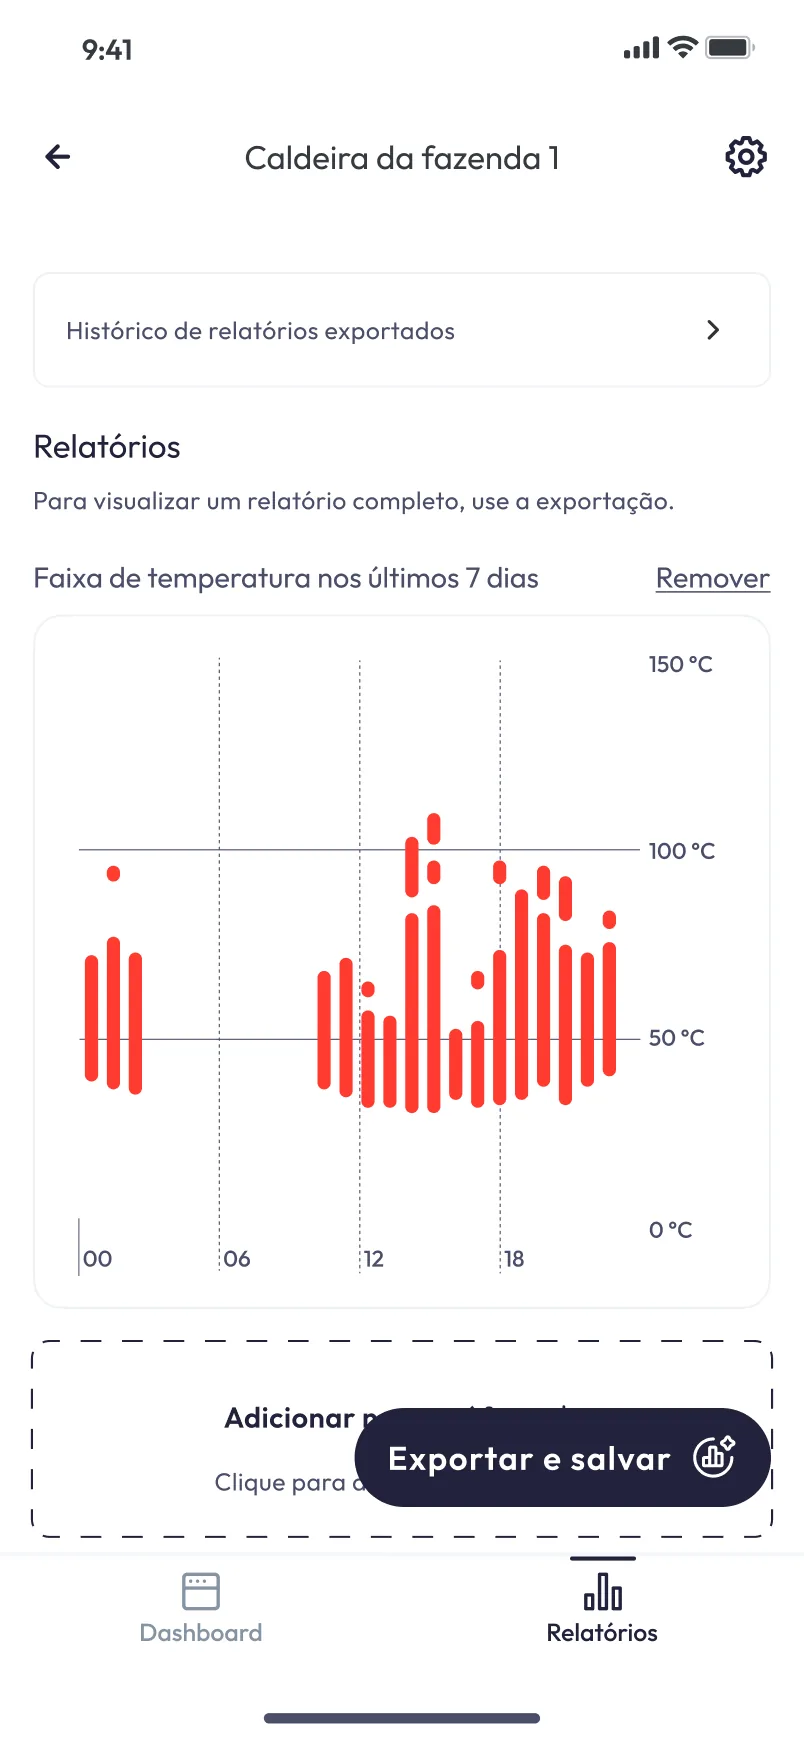
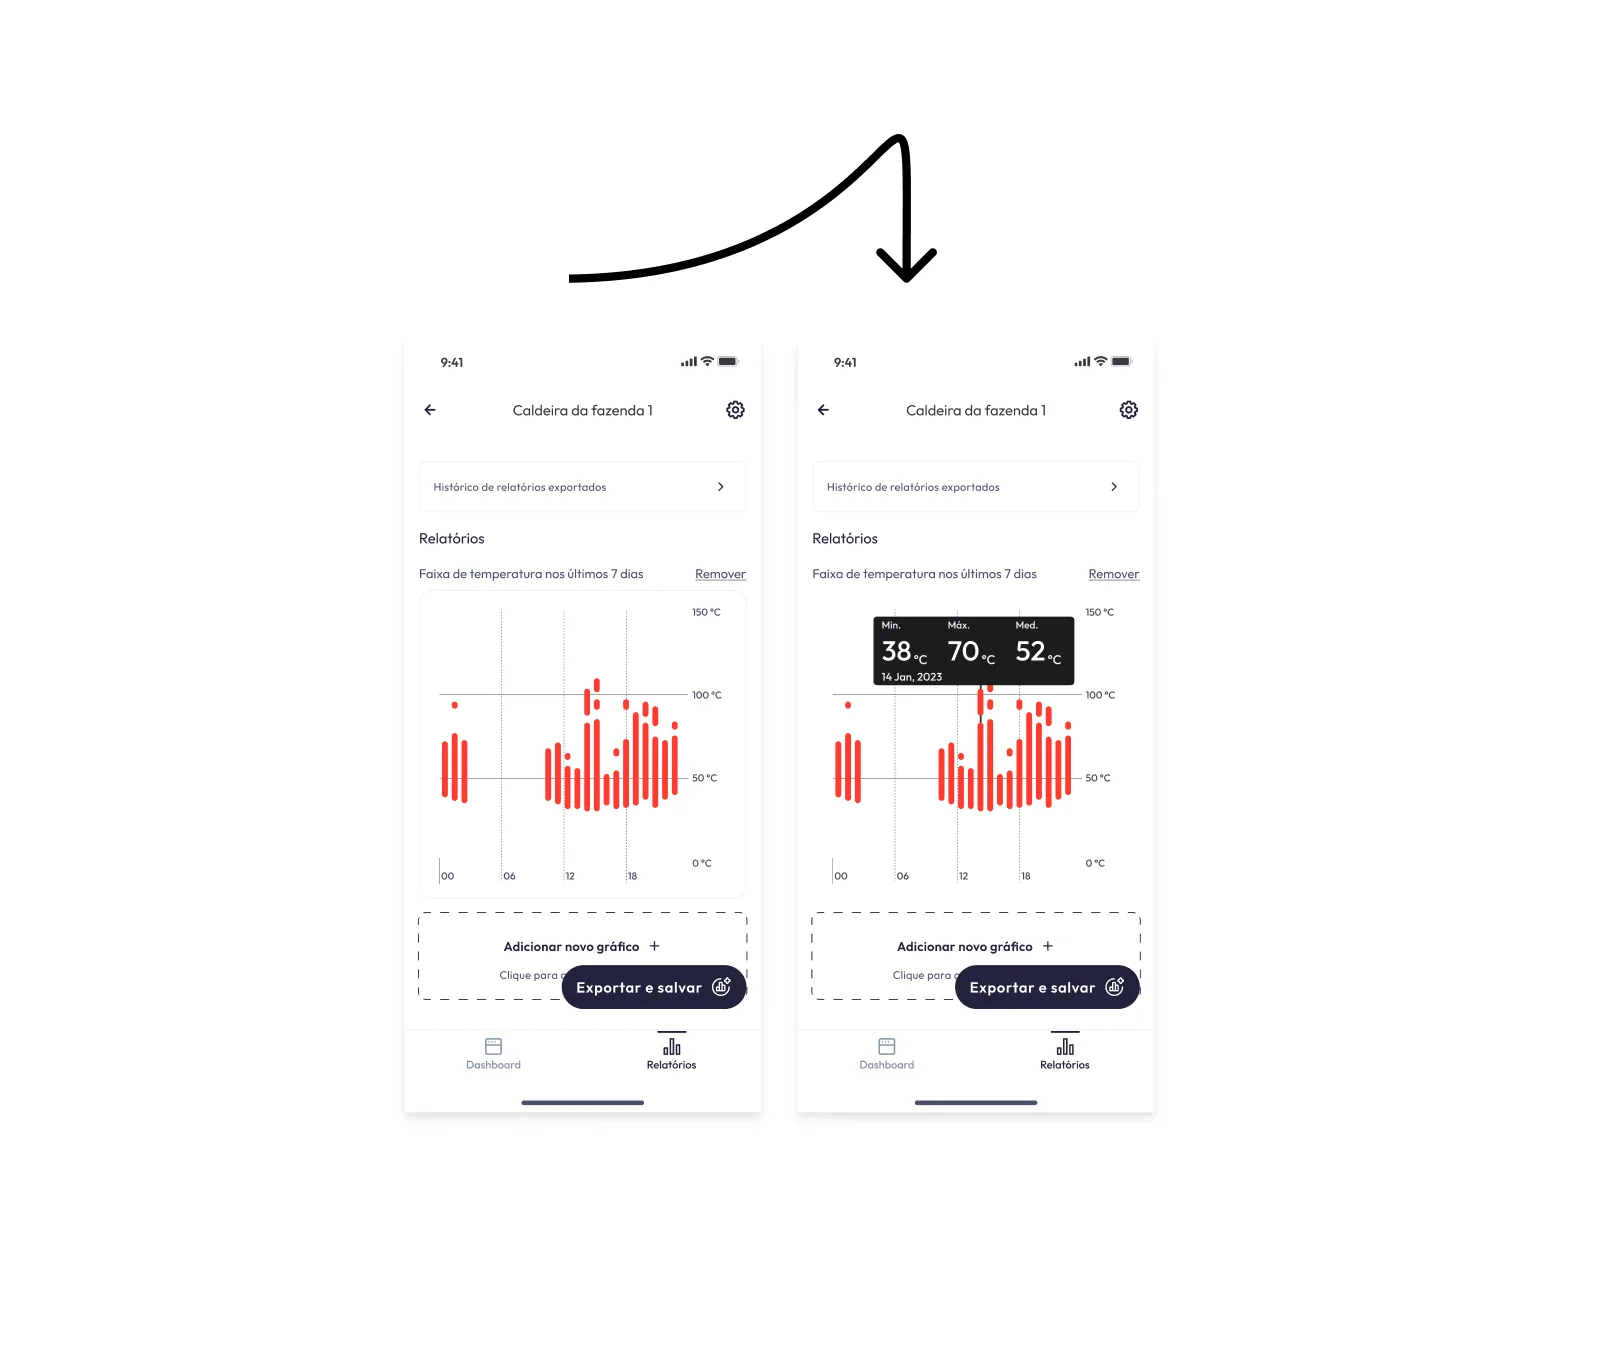
Relatórios shows the temperature range of the last seven days as red bars against fixed lines at 50 and 100 °C. Selecting a bar opens a dark tooltip with the minimum, maximum and average for that point, so the chart stays clean until someone asks for detail. Charts can be added and removed, and a report can be exported and saved, with past exports kept in a history.
Finding and looking after a sensor
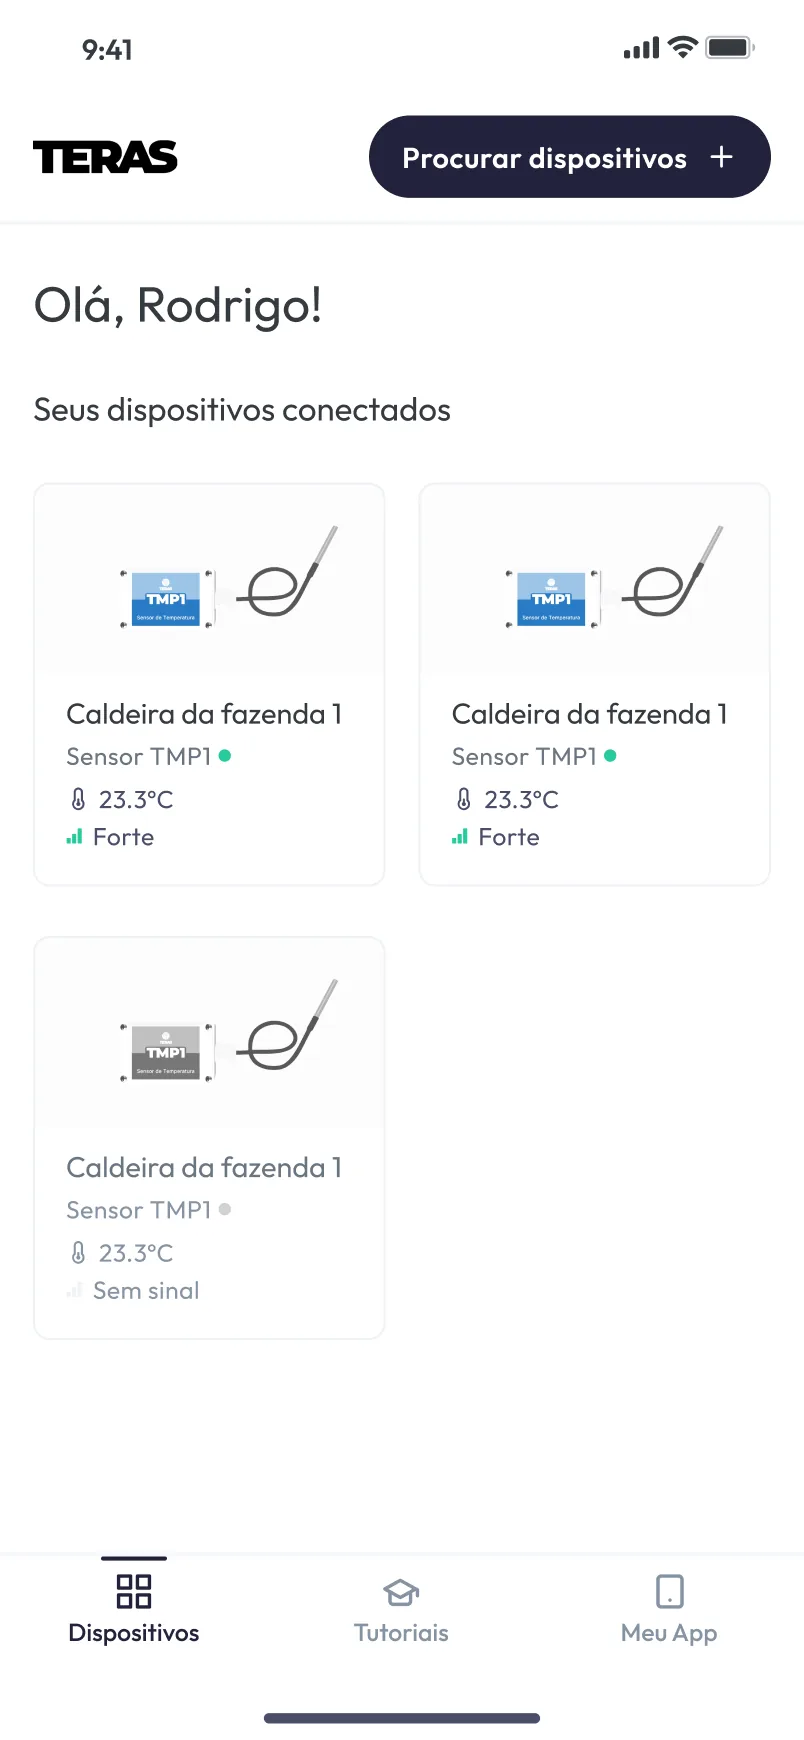
The home lists connected devices as cards with status, temperature and signal, and a sensor without signal fades to grey. Procurar dispositivos leads to a pairing list that marks each sensor’s signal as Forte, Médio or Fraco. Settings gathers storage, battery, the device name and the logging interval, and keeps the two destructive actions, clearing local records and disconnecting the sensor, at the end of the screen with red icons.