 YAN
Web app and dashboard design
Synergy Insurance Affiliates. Goals, offices and agents in one working view
A web and mobile platform for insurance affiliates, with prototype pages for Super Admin, Admin and Agent roles. It follows goals, sales, agents and campaigns by office and includes a form builder.
In short
- The problem
- A network of insurance offices needs a shared picture of performance, while each role has different responsibilities.
- My part
- I worked on desktop and mobile interfaces and user flows for Super Admin, Office Admin and Agent, including dashboards, goals and a form builder.
- The key decision
- Separate reading performance from changing the operation. The navigation groups analytics and management, while an office selector changes the scope of the dashboard and ranking together.
- Contribution
- Role-based user flows, desktop and mobile UI
- Project status
- Interface design · Figma archive
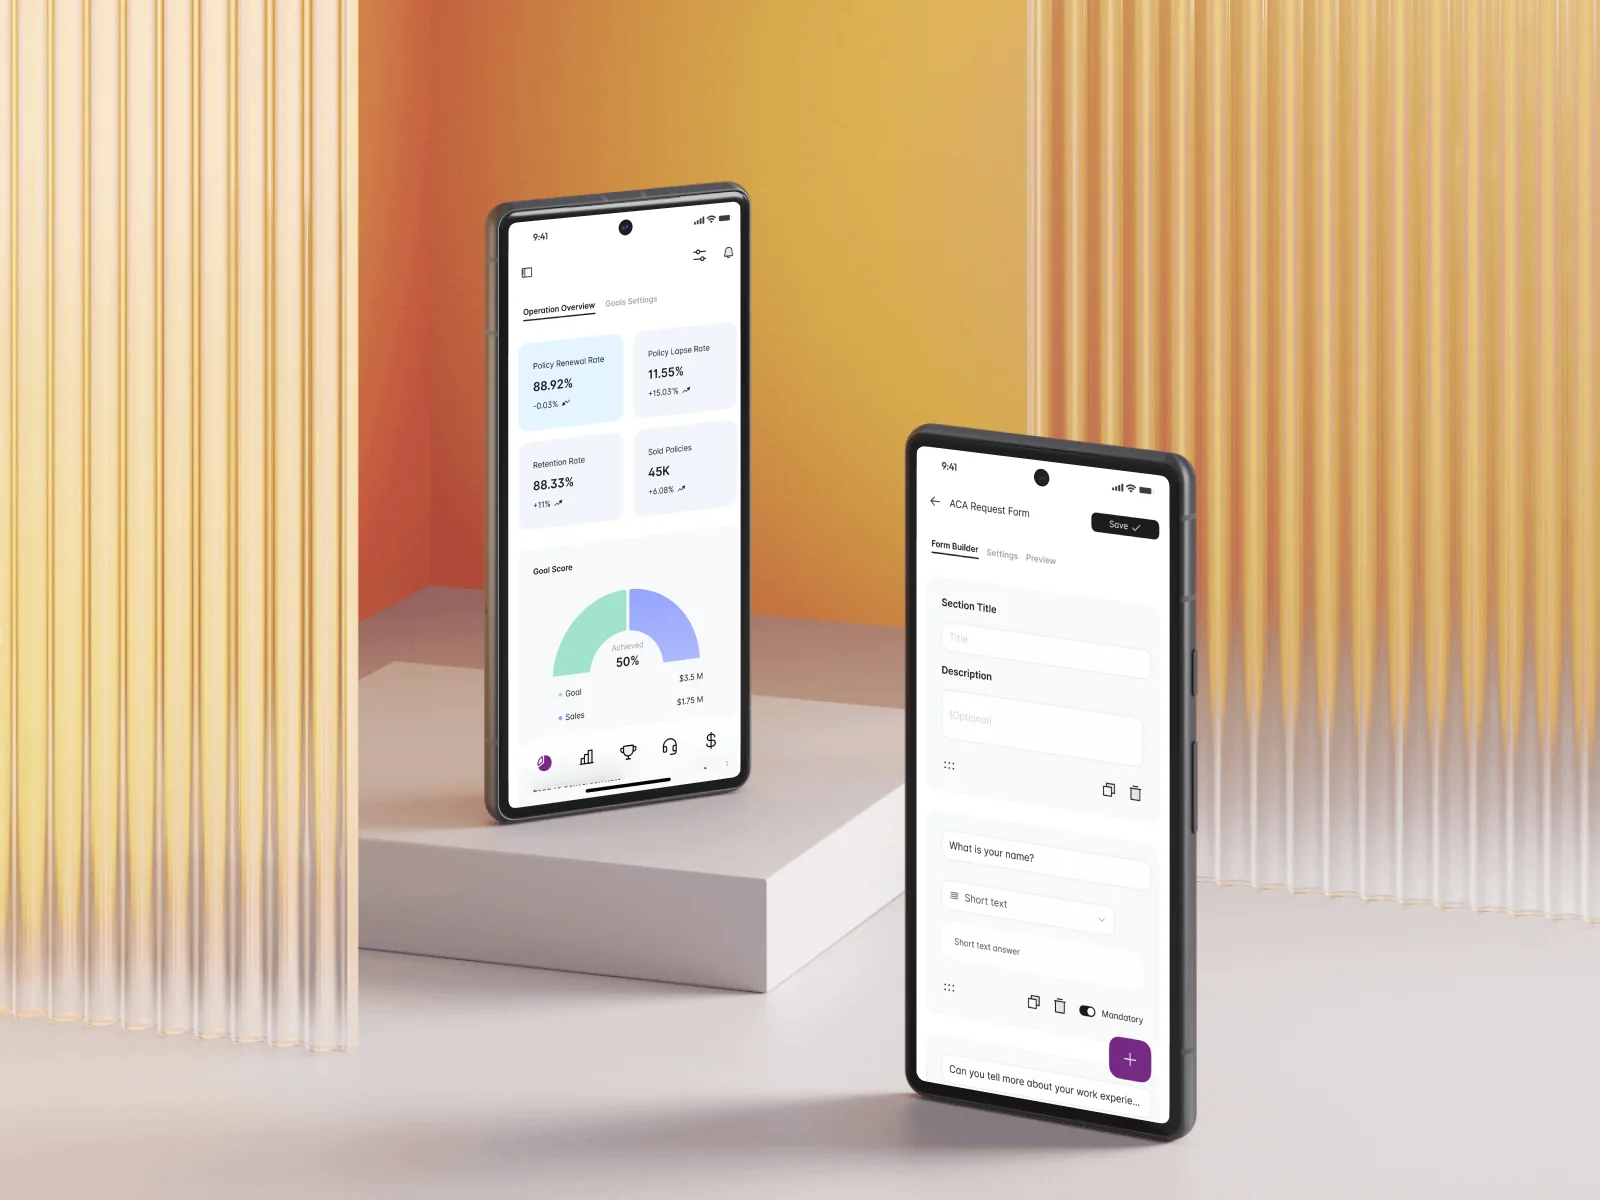
Screens from the original Figma design files, with sample data.
My contribution
I worked on the user flows and desktop and mobile interfaces for Synergy Insurance Affiliates, archived under Media Base / Base Media. The design covers Super Admin, Office Admin and Agent roles, with separate prototype pages for each role in both formats.
The material shown here is a Figma design and prototype set. The desktop screens share the Super Admin menu. Names, photos and figures are sample content used to demonstrate the interface; the case makes no claim about production usage or business results.
From roles to information hierarchy
The user flows cover three roles: Super Admin, Office Admin and Agent. From the dashboard, the Super Admin flow branches into goals, affiliate performance, financial analytics, the leaderboard, affiliate offices and forms.
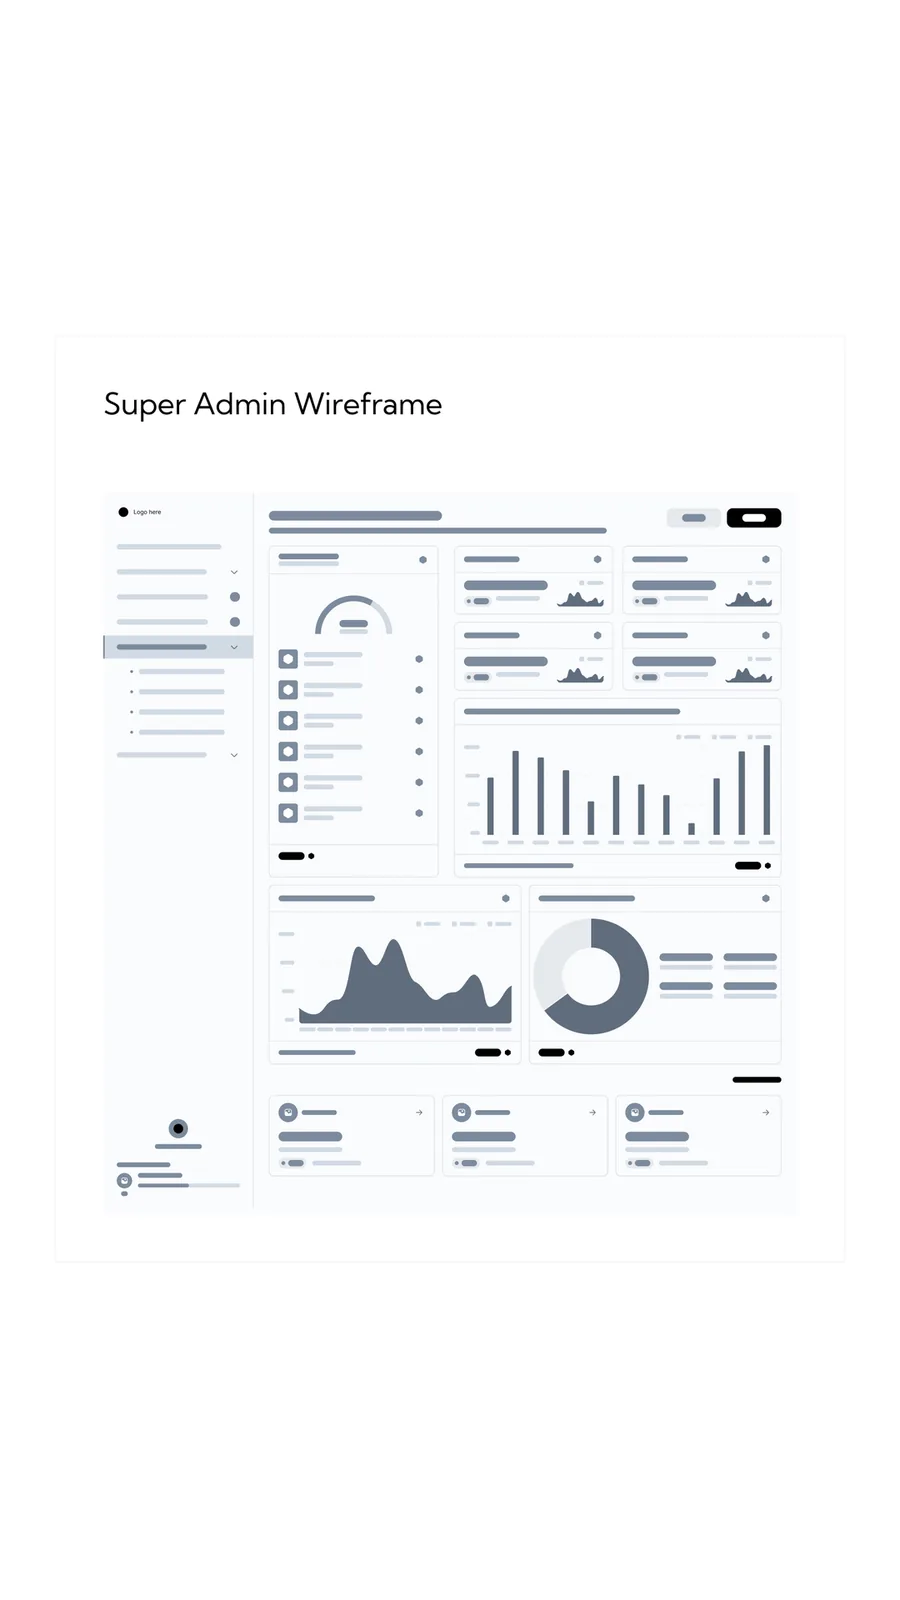
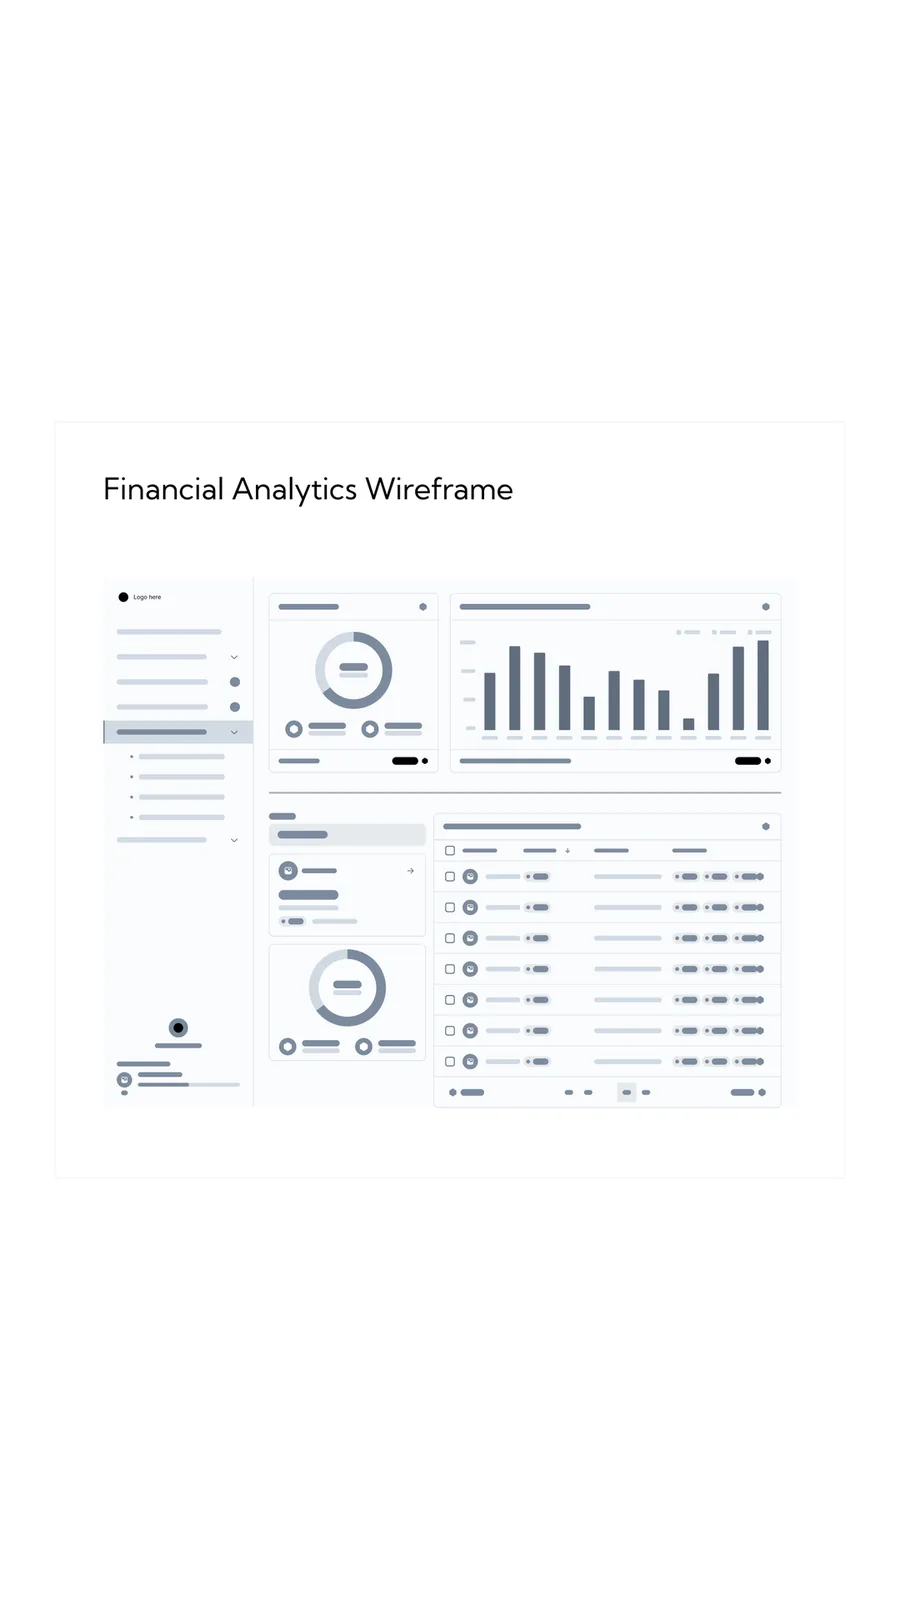
The grayscale wireframes make the hierarchy visible without relying on branding: summary measures, comparisons and detailed records occupy distinct areas. In the finished interface, Analytics, Management and Account separate monitoring from actions that change the operation. A performance check and an administrative task therefore have different destinations.
Start wide, then choose an office
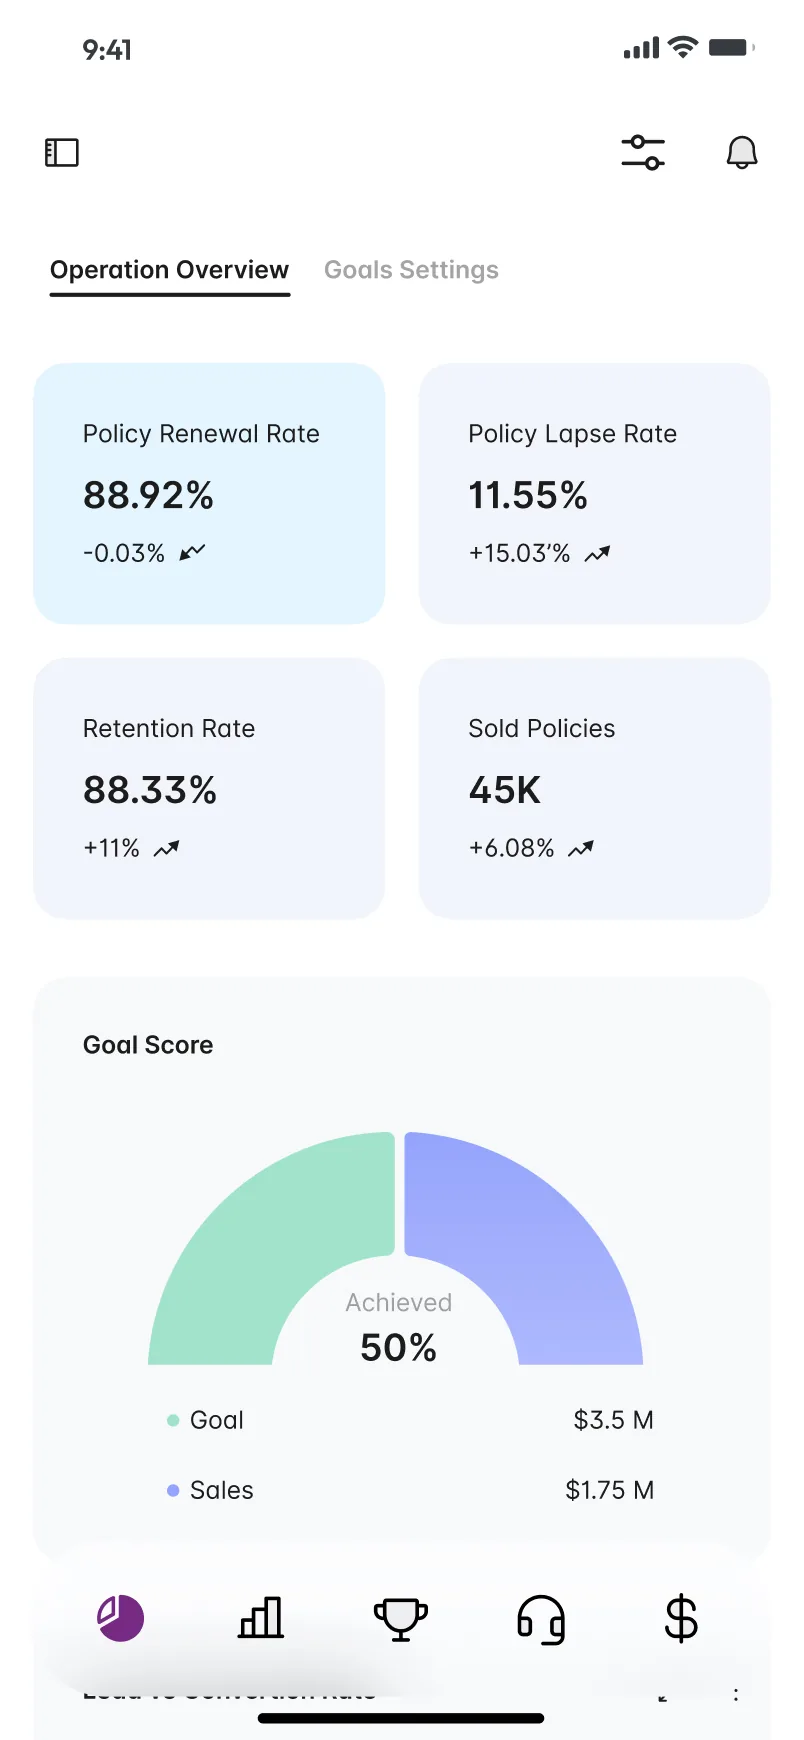
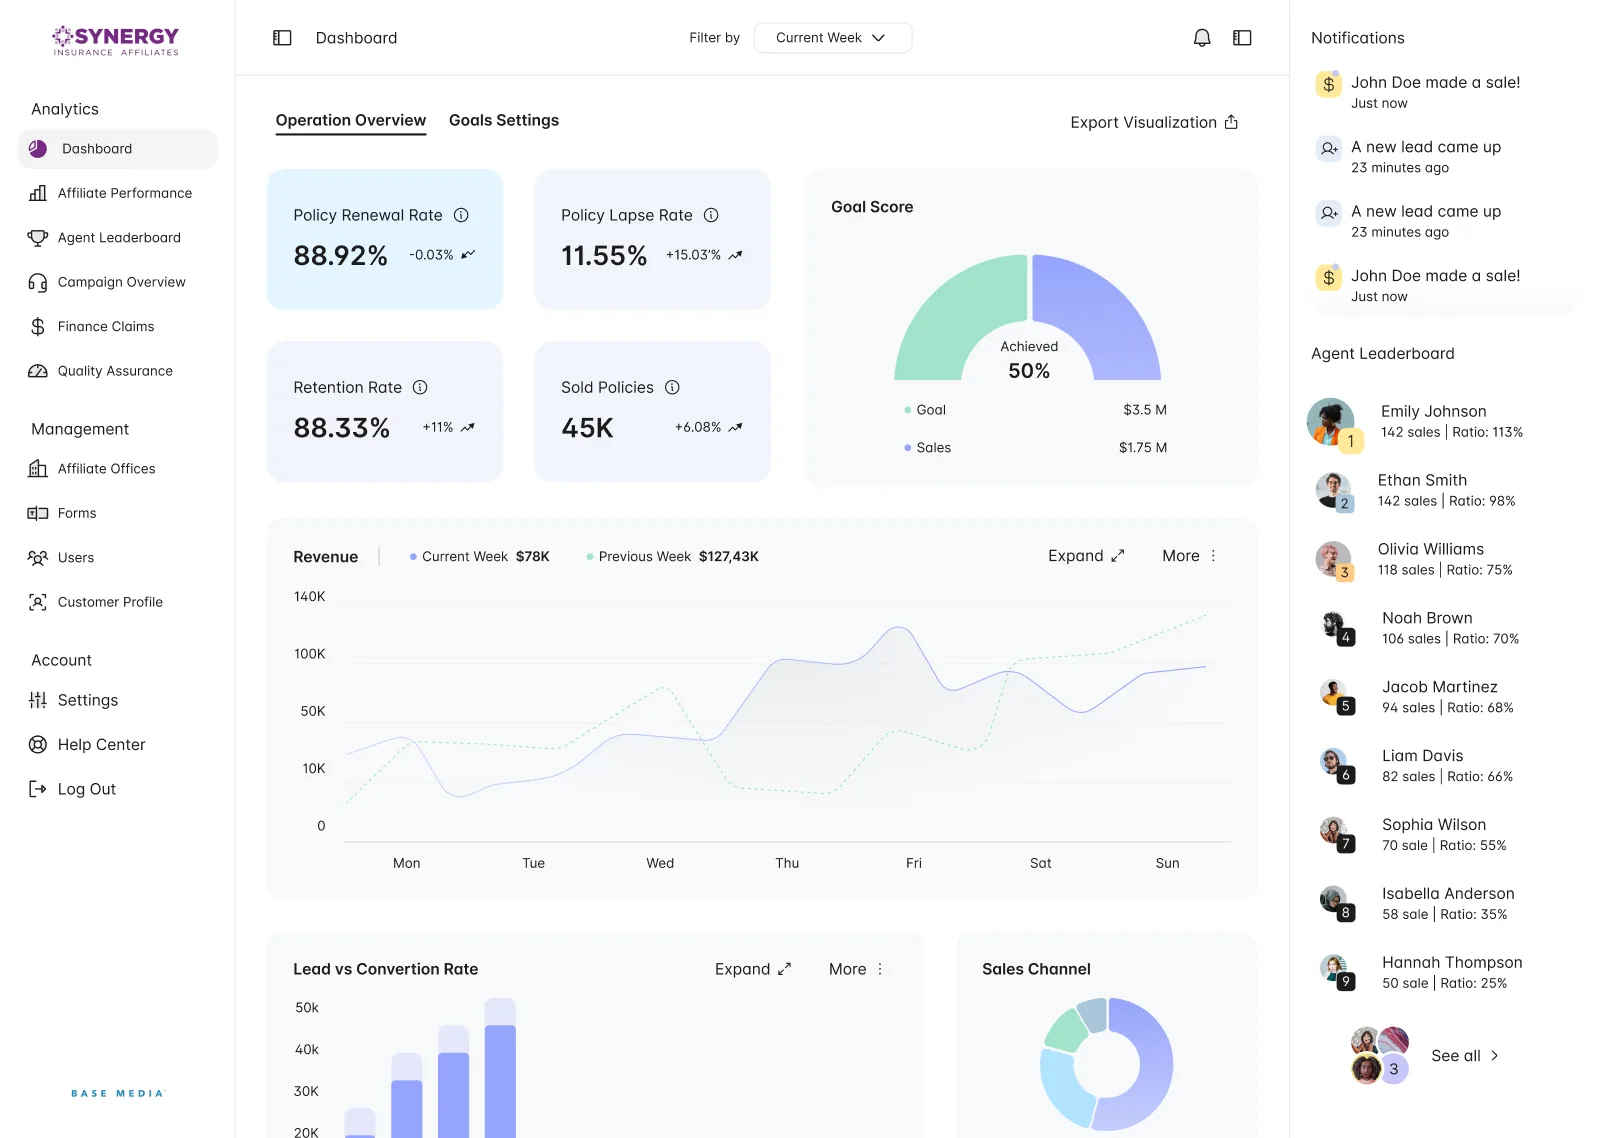
The first decision is the scope of the question: how is the network performing, and which office needs a closer look? The dashboard starts with renewal, lapse, retention and sold policies, then places the Goal Score and weekly revenue alongside that overview. The design keeps the network context visible before moving into an individual office.
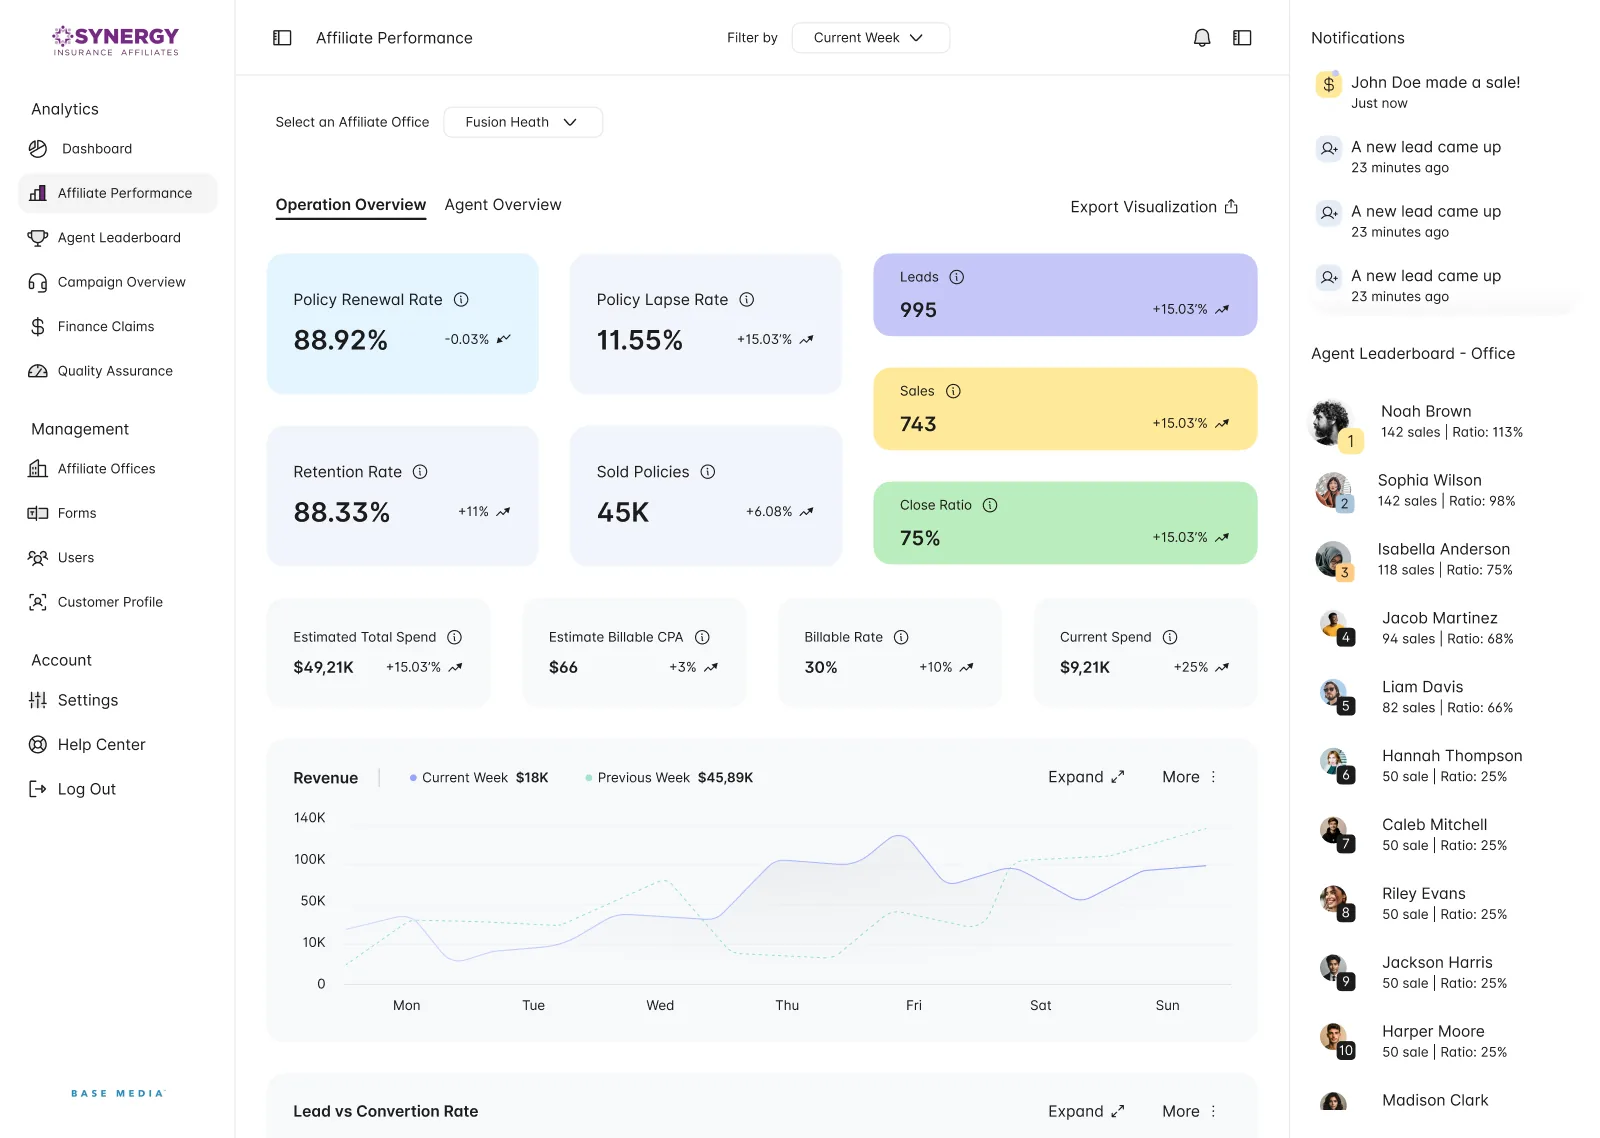
Affiliate Performance repeats that reading for one office, chosen in a selector at the top. It adds coloured tiles for leads, sales and close ratio and a row of spend figures, and the right column follows the choice: the leaderboard becomes Agent Leaderboard - Office.
A ranking with the reasons beside it
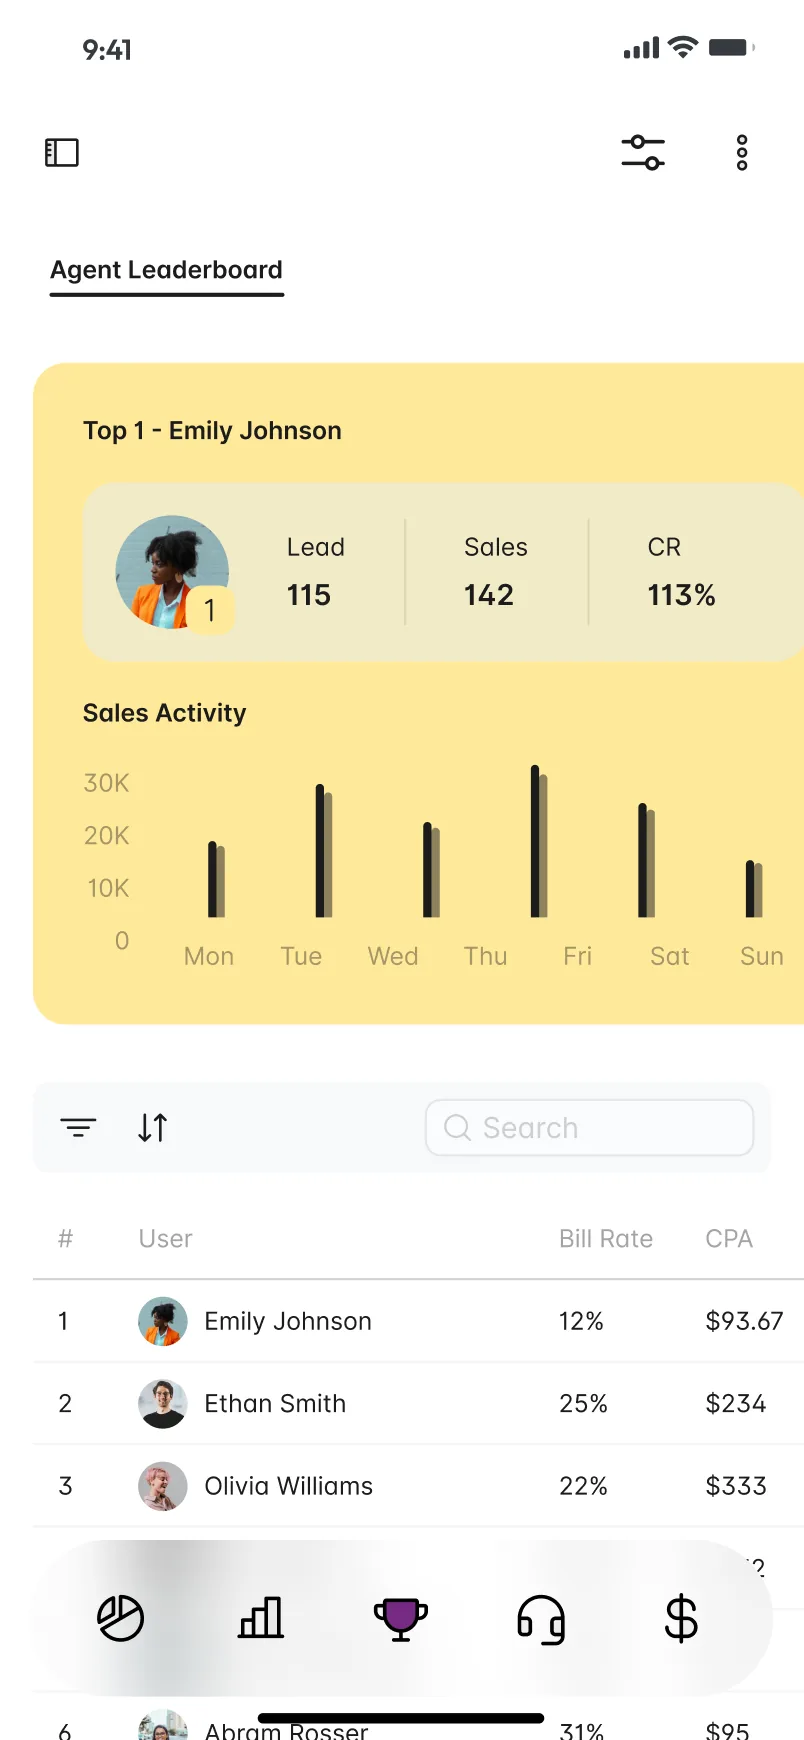
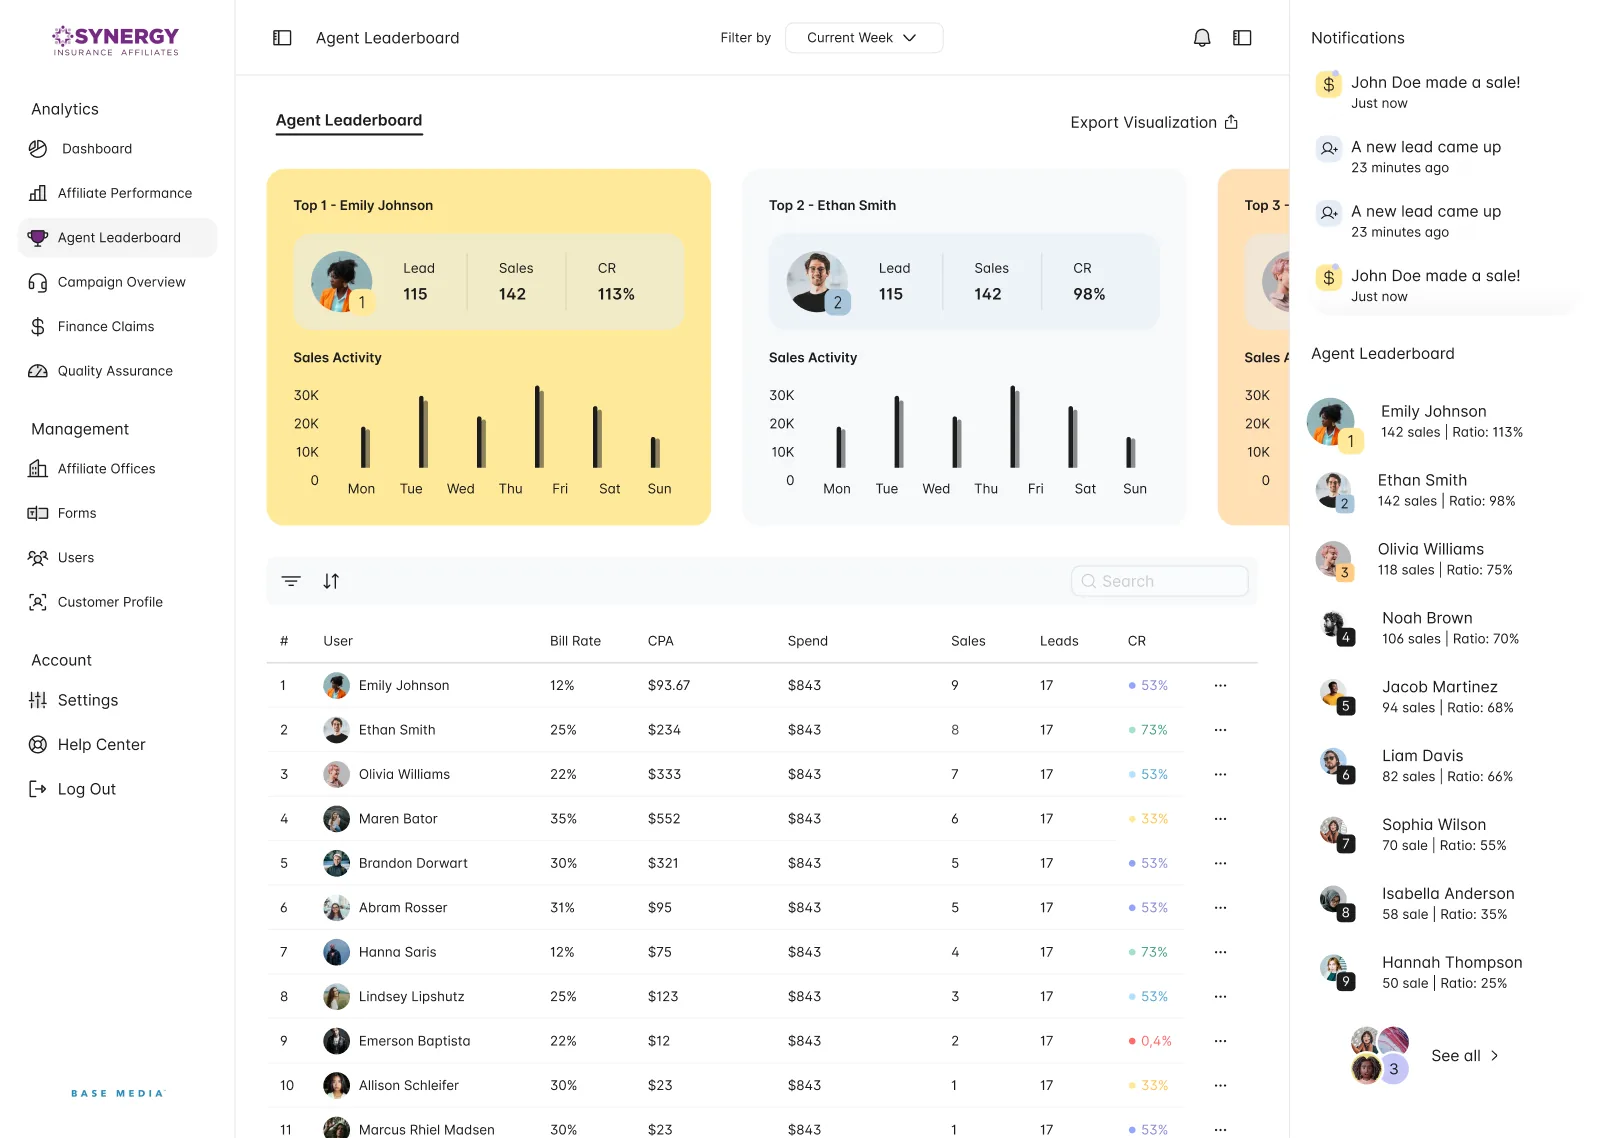
The Agent Leaderboard gives the top agents large cards with leads, sales, conversion rate and a week of sales activity. Yellow marks first place, and the row of cards carries on behind the right column. The table below lists every agent, with bill rate, CPA, spend, sales, leads and conversion rate on one row.
A short version of this list stays in the right column, under Notifications, on most desktop screens, so the ranking and the latest sales and leads remain in view during other tasks.
Campaigns by share of sales
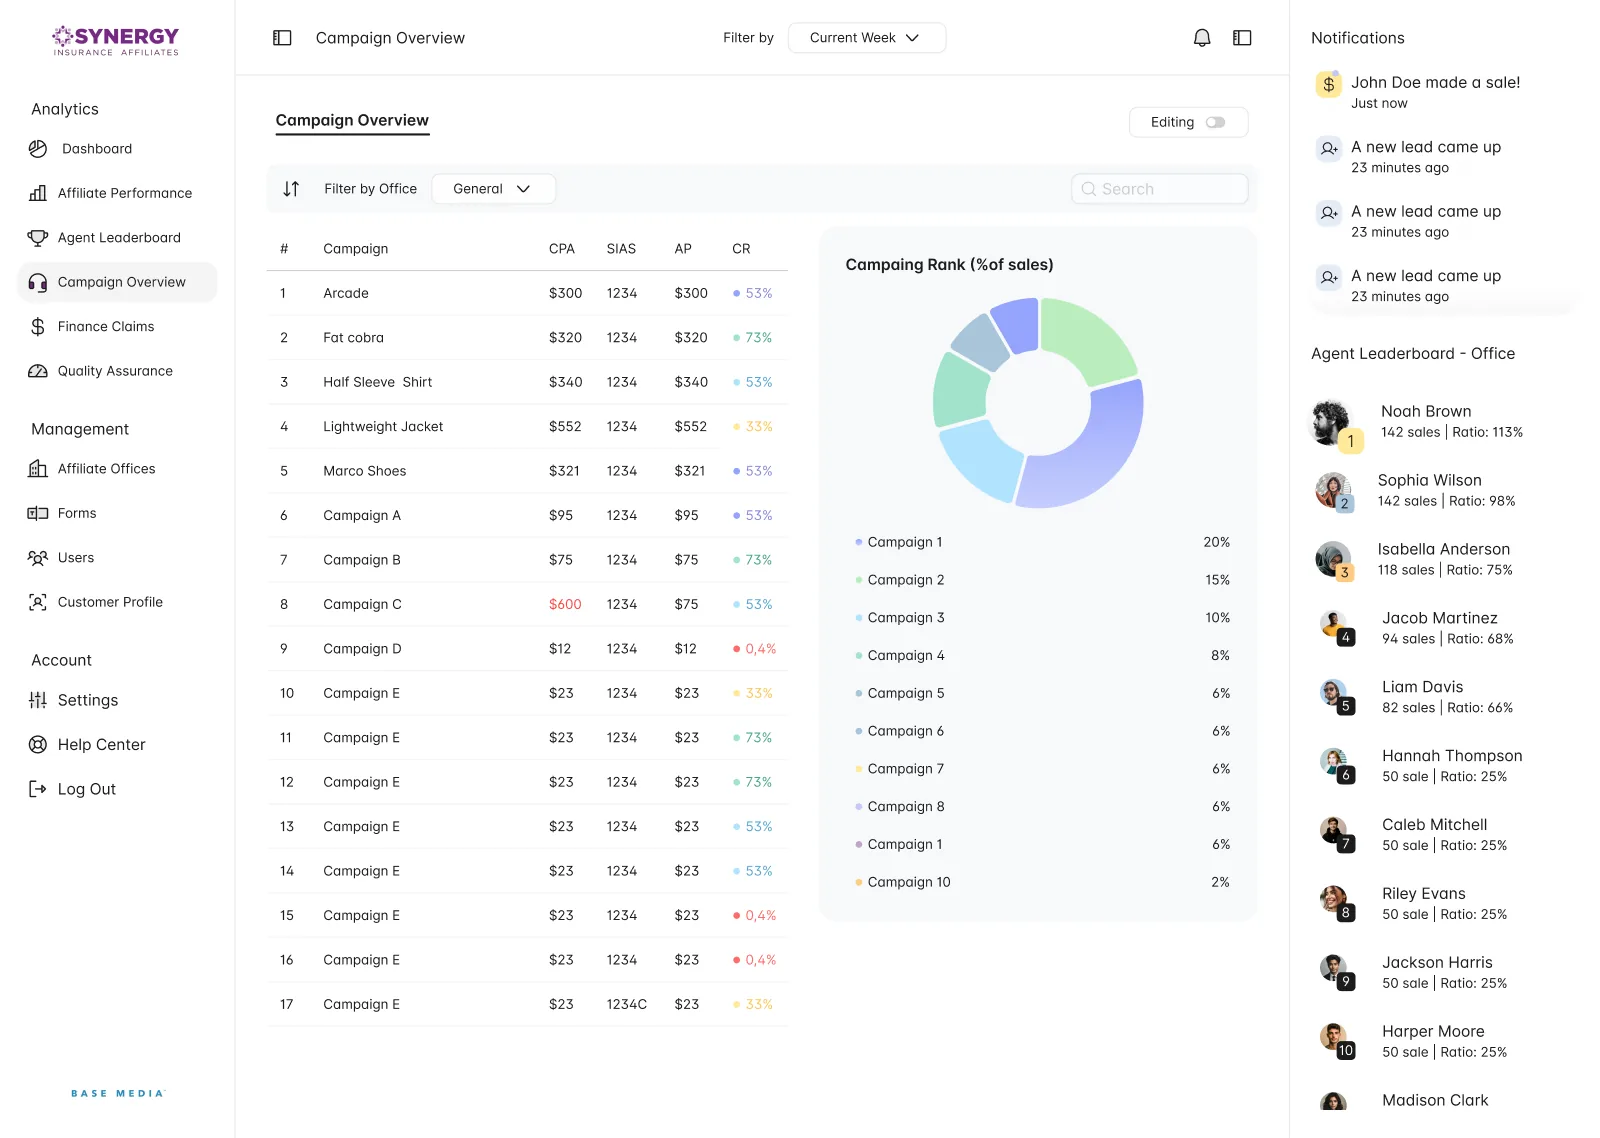
Campaign Overview pairs a table with a donut showing each campaign’s share of sales. Conversion rates carry a coloured dot, from red at the lowest to green at the highest, which helps weak campaigns stand out in a long list. A filter narrows the view by office, and a switch turns editing on.
Forms built inside the product
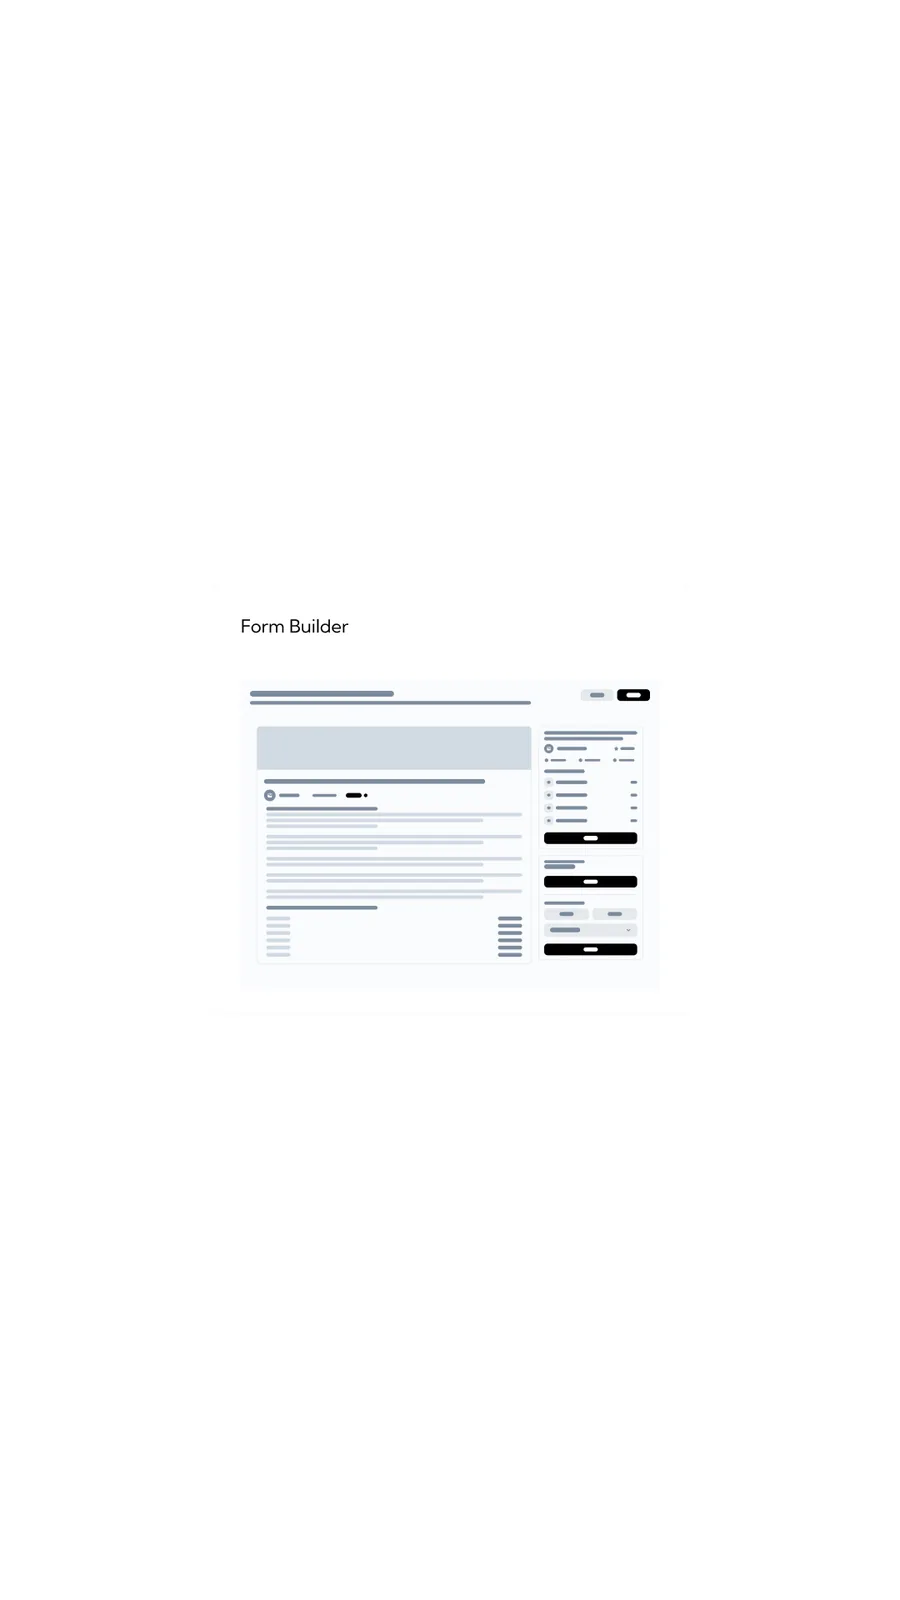
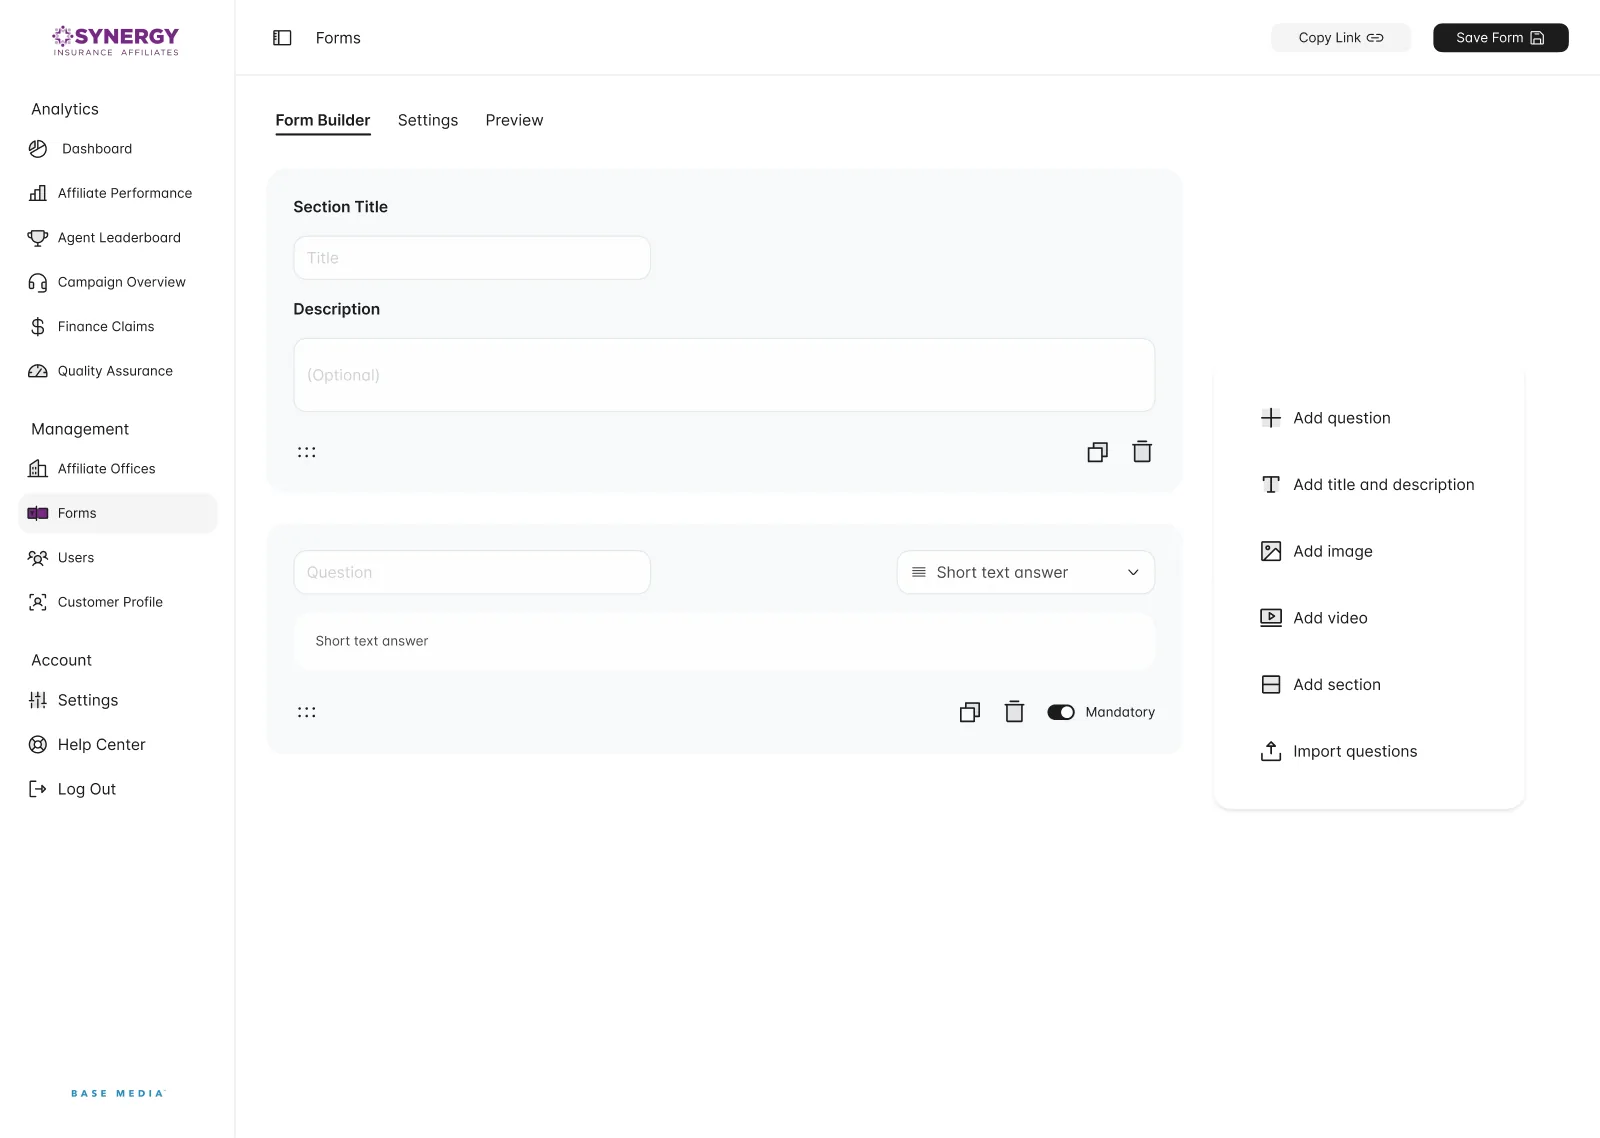
The form-builder wireframe gives the document and its editing tools separate spaces. The finished design keeps that split: questions occupy the main column while the right panel adds content. Form Builder, Settings and Preview distinguish editing a question, configuring the form and checking the result.
Forms work like a small editor with three tabs: Form Builder, Settings and Preview. Each question holds its own answer type and mandatory switch, and every block can be duplicated or deleted. The notification column gives way to a panel for adding questions, titles, images, videos and sections or importing questions, with Copy Link and Save Form at the top.
The same operation on a phone
The mobile design prioritises the same operational questions with less simultaneous detail. Goal progress stays visible, tables show fewer columns, and adding a form element moves from a permanent side panel to a floating action. The task remains available while the layout changes around the smaller screen.
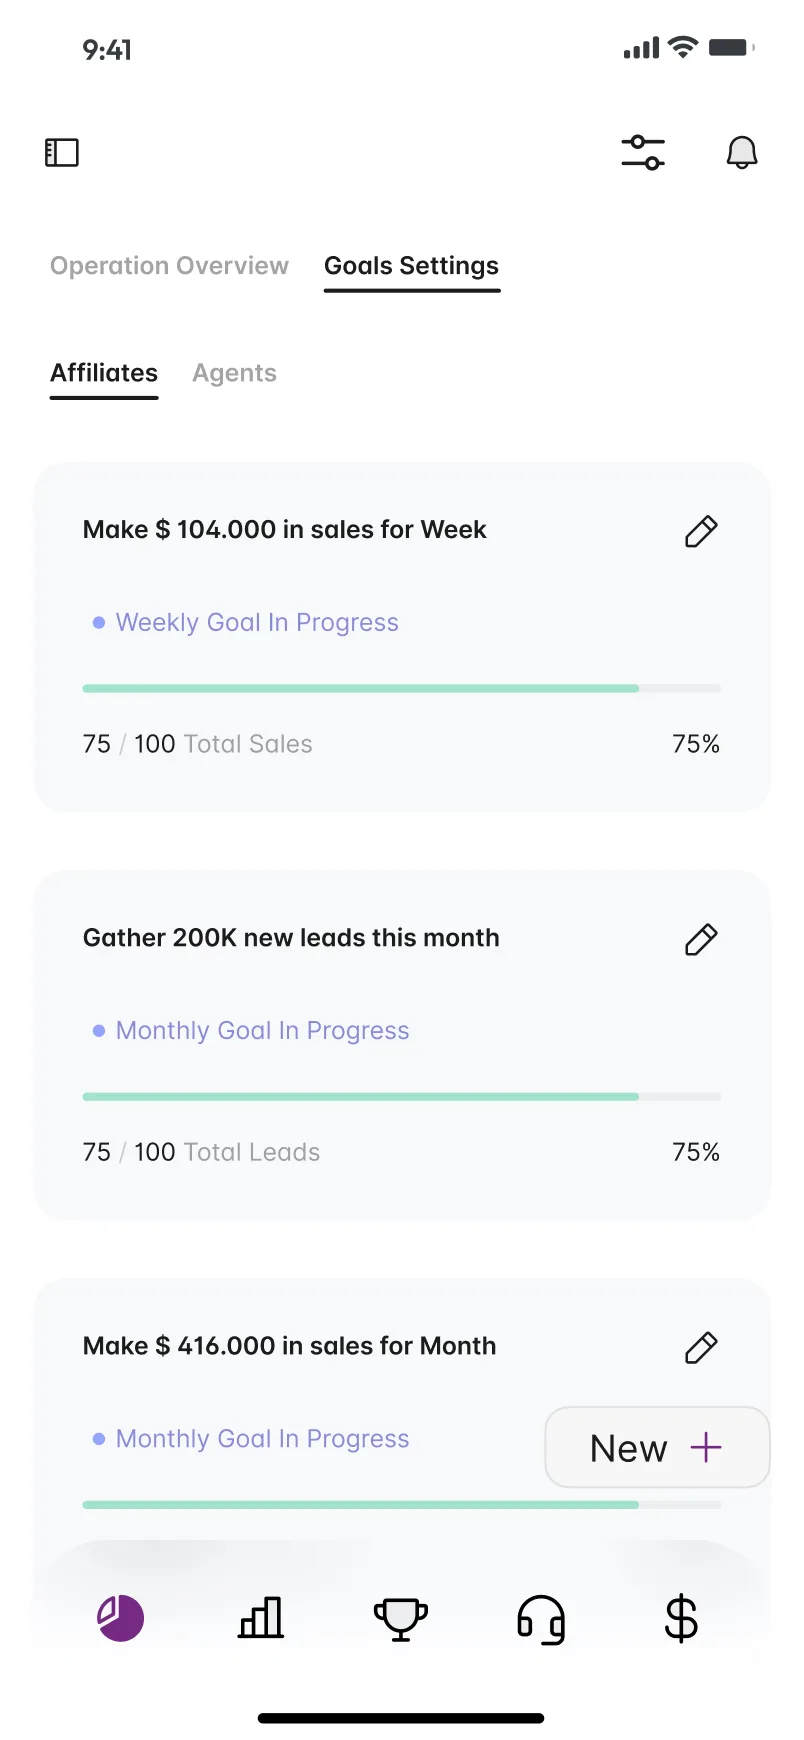
On a phone, a floating bar of five icons reaches the main areas, and the rates rearrange into a two-by-two grid above the Goal Score. Under Goals Settings, tabs separate affiliates and agents, and each goal is a card with its target, weekly or monthly status, a progress bar and an edit pencil.
The leaderboard keeps its yellow card and trims the table to the first columns. The form builder stacks into one column, with a floating plus button where the desktop has its side panel.