 YAN
Web app and dashboard design
ÉOS Energia. One dashboard, read from three sides of solar energy
A Portuguese platform for shared solar energy, with one dashboard structure adapted for administrators, producers and consumers, plus a mobile site menu.
- Contribution
- Product flows and interface design
- Project status
- Interface design · Figma archive
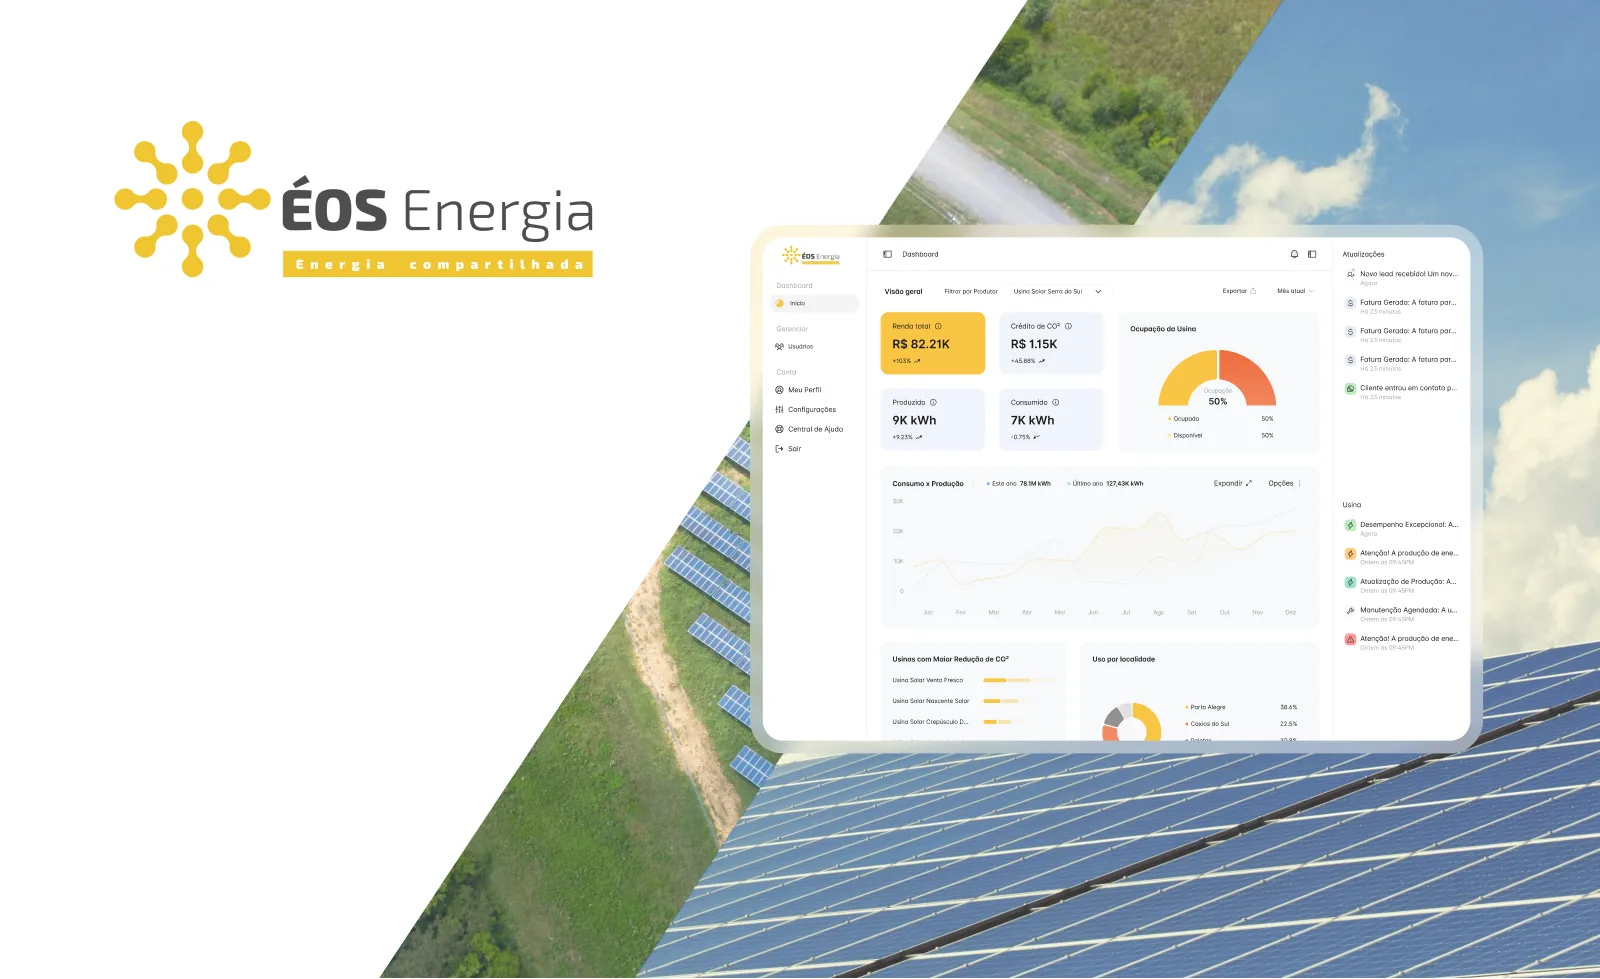
Screens from the original Figma design file, with sample data.
My contribution
ÉOS Energia is a Portuguese platform for solar plants, with the idea of shared energy in its own logo. The same dashboard exists for three roles: Administrador, Produtor and Consumidor.
The design file also covers profile, documents, invoices, chart and contract overlays, and login and pre-registration forms. The figures on these screens are sample data.
The same frame, three starting points
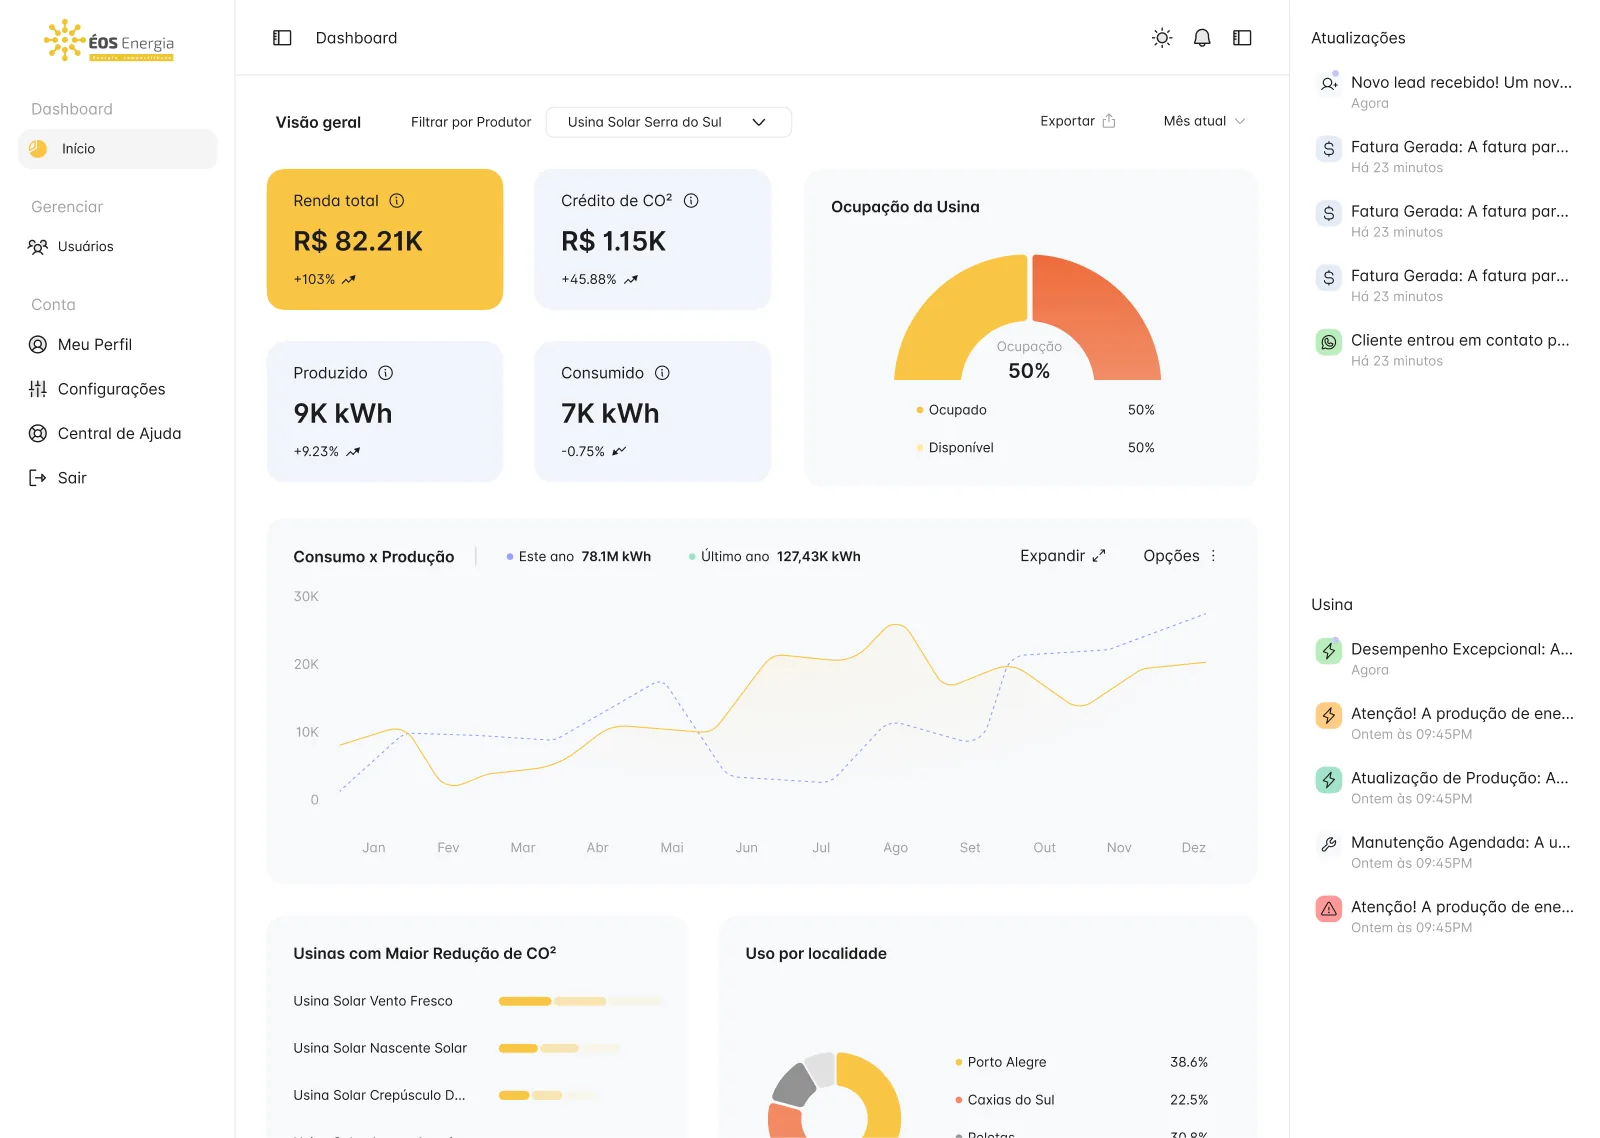
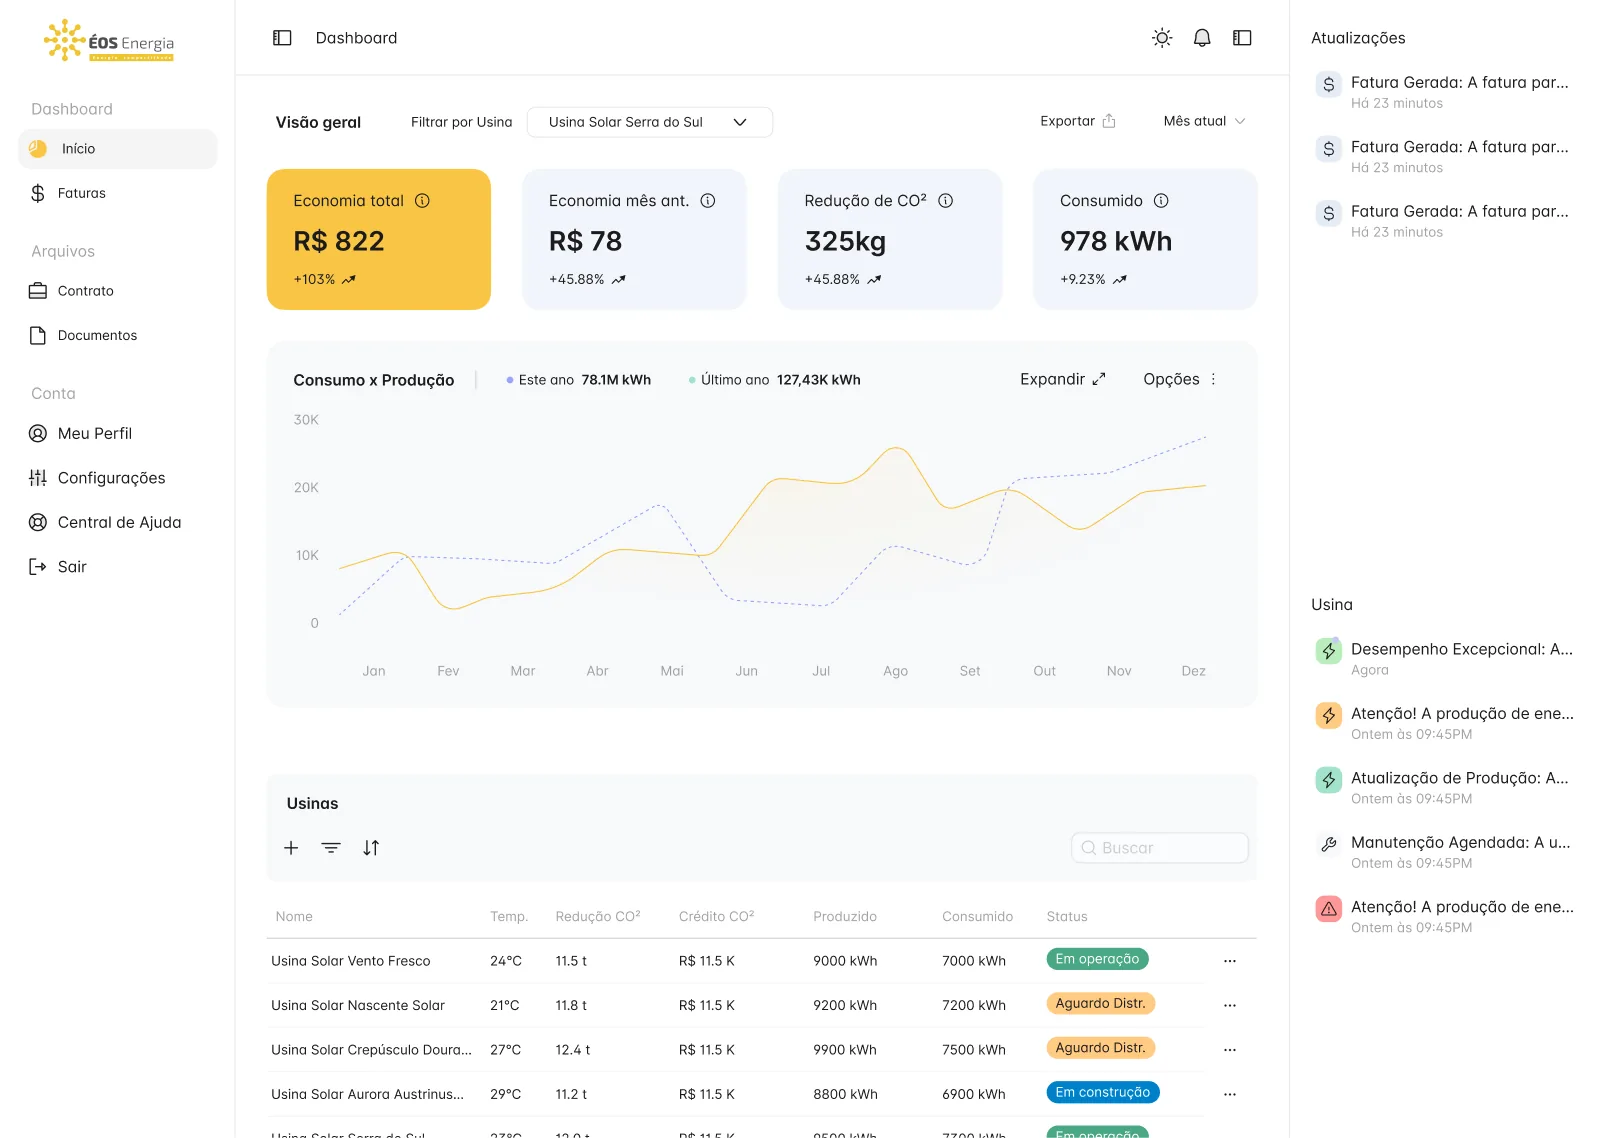
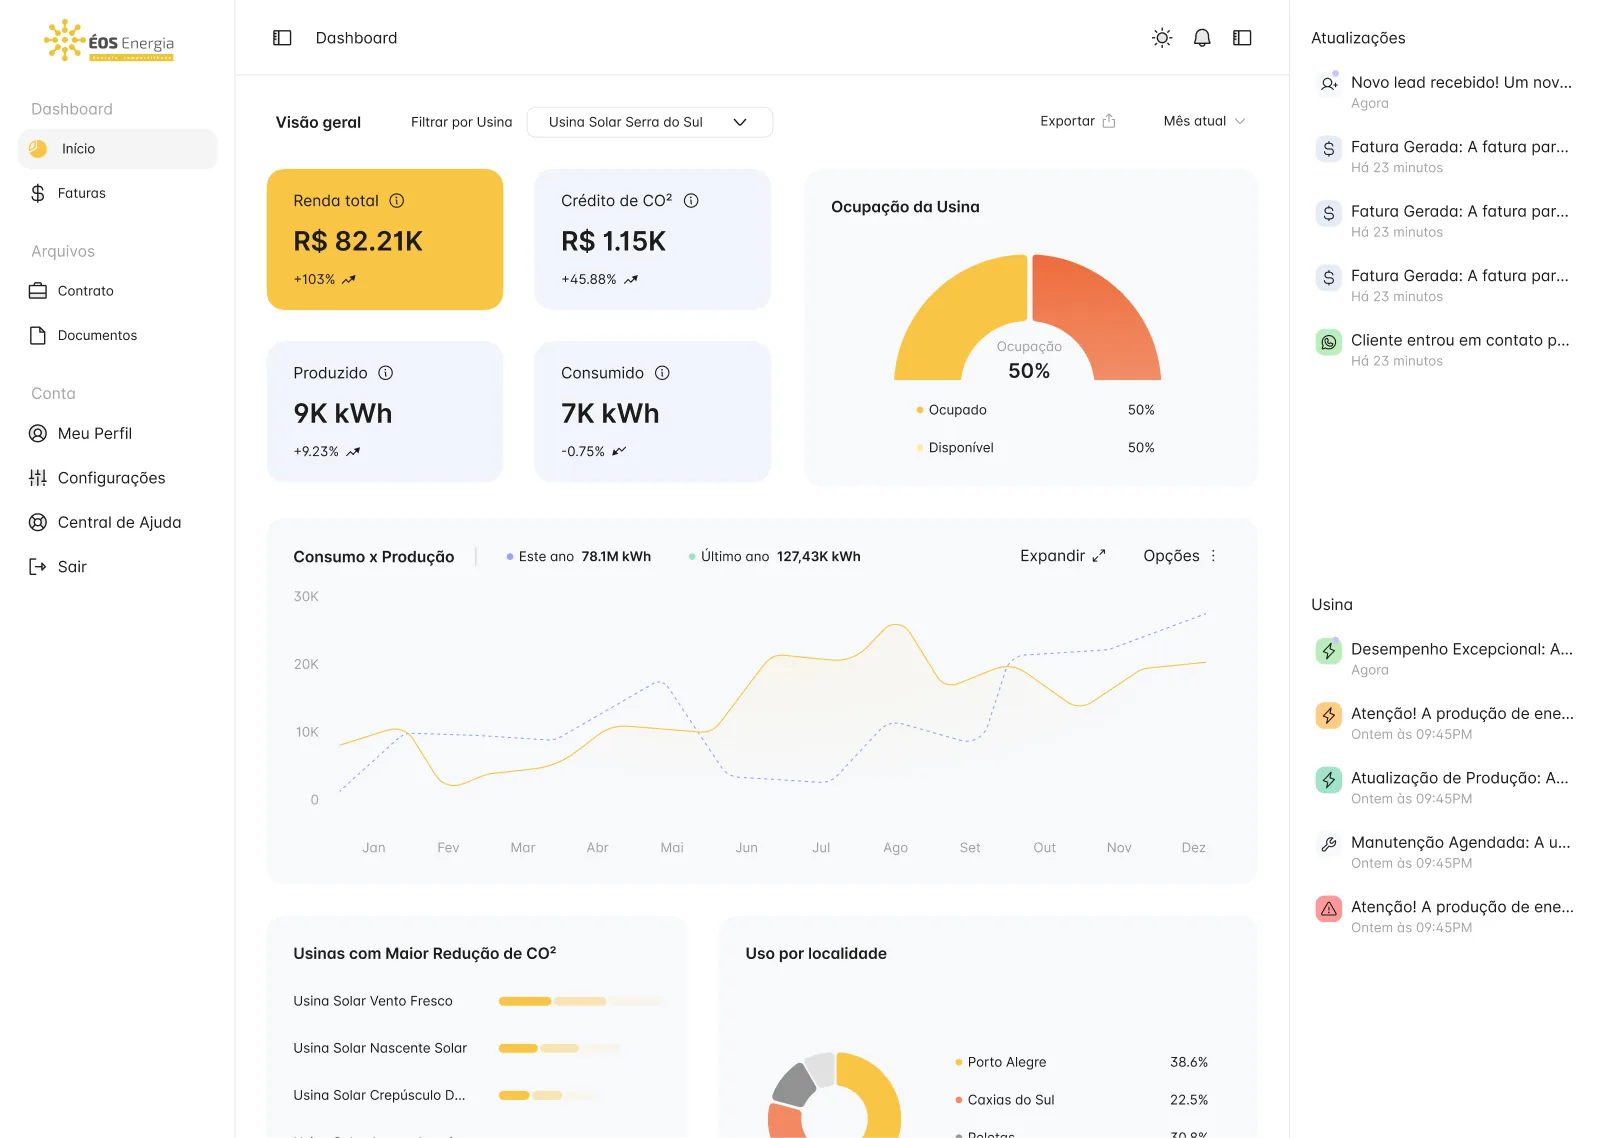
All three views share a left menu, a central overview and a right column of updates. With that frame fixed, the difference between roles shows up in what fills it: the top filter reads by producer for the administrator and by plant for the other two, and the menu changes with what each role can do.
The administrator gets Usuários under Gerenciar. The producer and the consumer get Faturas, plus Contrato and Documentos under Arquivos, so the account’s paperwork sits next to the numbers.
What each role reads first
For the administrator and the producer, the first block combines income, CO² credit, production and consumption beside a gauge of plant occupancy, with consumption and production compared below. One yellow tile marks the figure to read first, and the others stay pale.
The consumer view replaces income with savings and CO² reduction, drops the gauge and adds a table of plants with temperature, production and a status pill such as Em operação or Em construção. The structure stays familiar, but the question moves from what the plant earned to what the account saved and how its plants are doing.
The site around the platform
The file also keeps several versions of the landing page. On a phone, its menu separates the main links from a Mais group, then ends with Falar com um consultor as a yellow button and a text link for existing accounts.